Four Dataviz Posters
I was asked for some examples of posters I’ve made using R and ggplot. Here are four. Some of these are done from start to finish in R, others involved some post-processing in Illustrator, usually to adjust some typographical elements or add text in a sidebar. I’ve linked to a PDF of each one, along with a pointer to the original post about the graphic.
If you’re interested in learning more about how to making graphs and charts using R and ggplot, then by a staggering coincidence there’s a new visualization book out that can help you with that.
Vaccination Exemptions in California Kindergartens
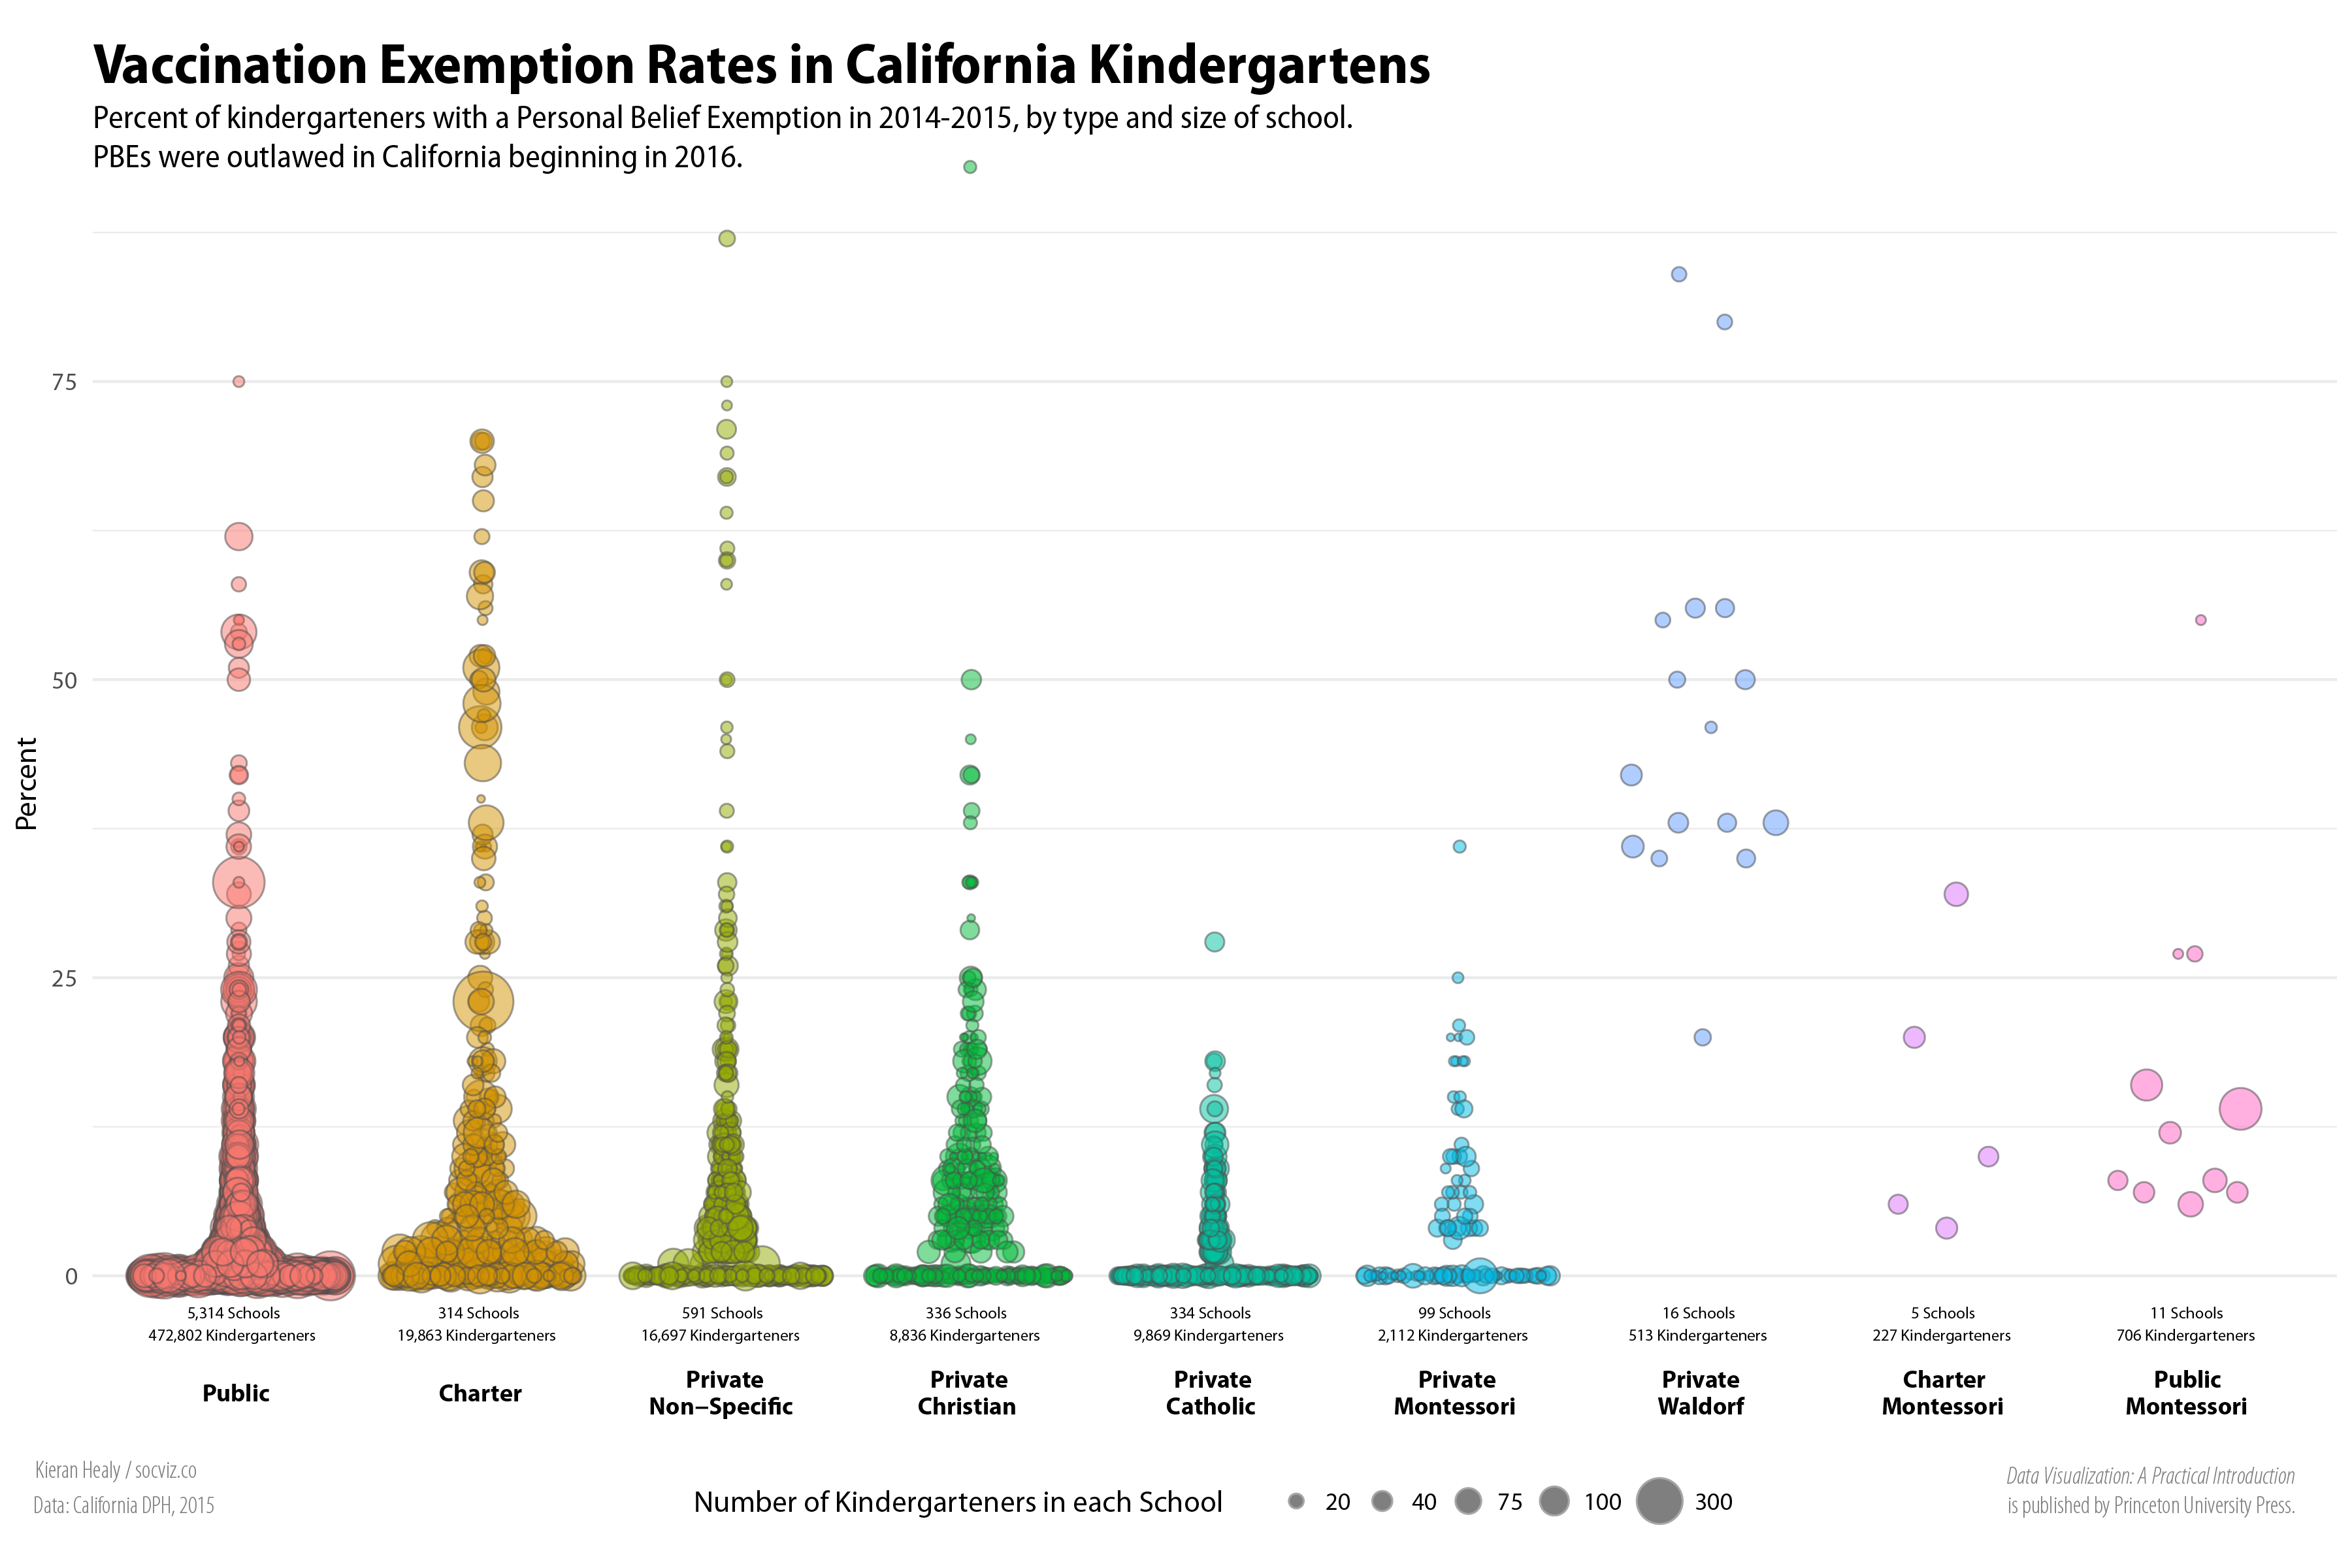
Vaccination exemptions poster.
A Co-Citation Network for Philosophy
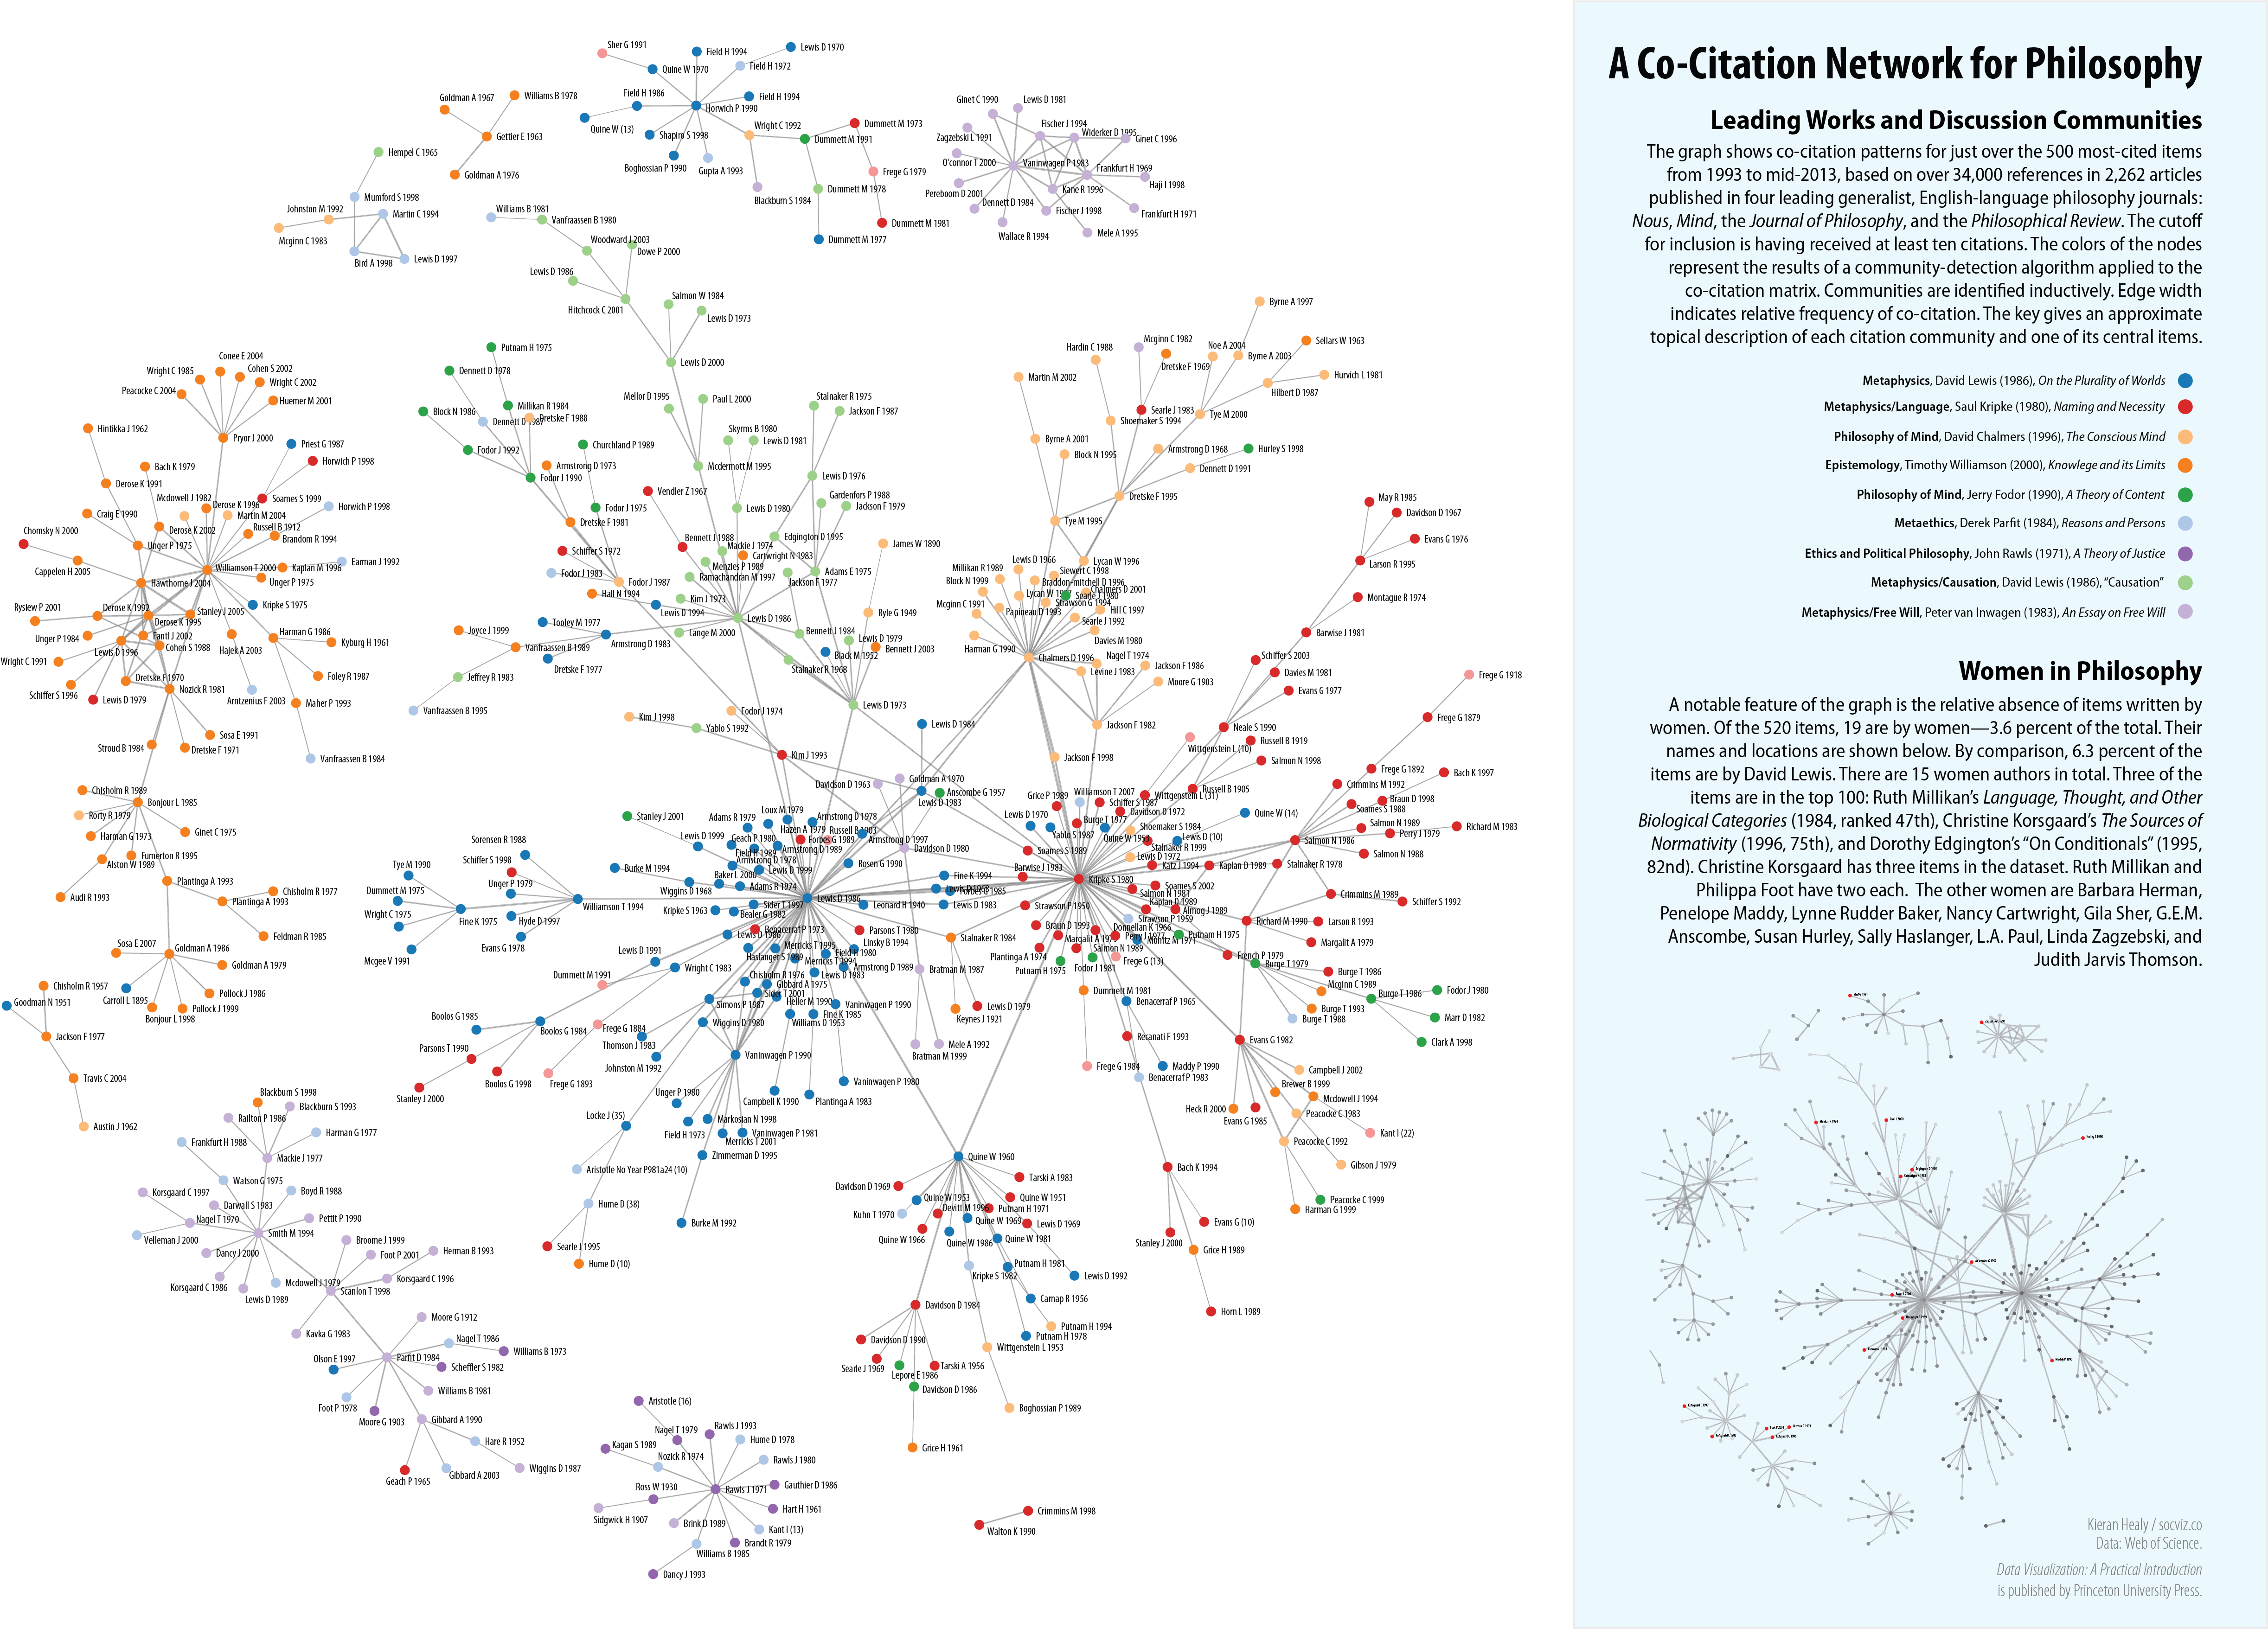
Co-Citation in Philosophy.
Mortality in France, 1816-2016

French mortality.
Visualizing the Baby Boom
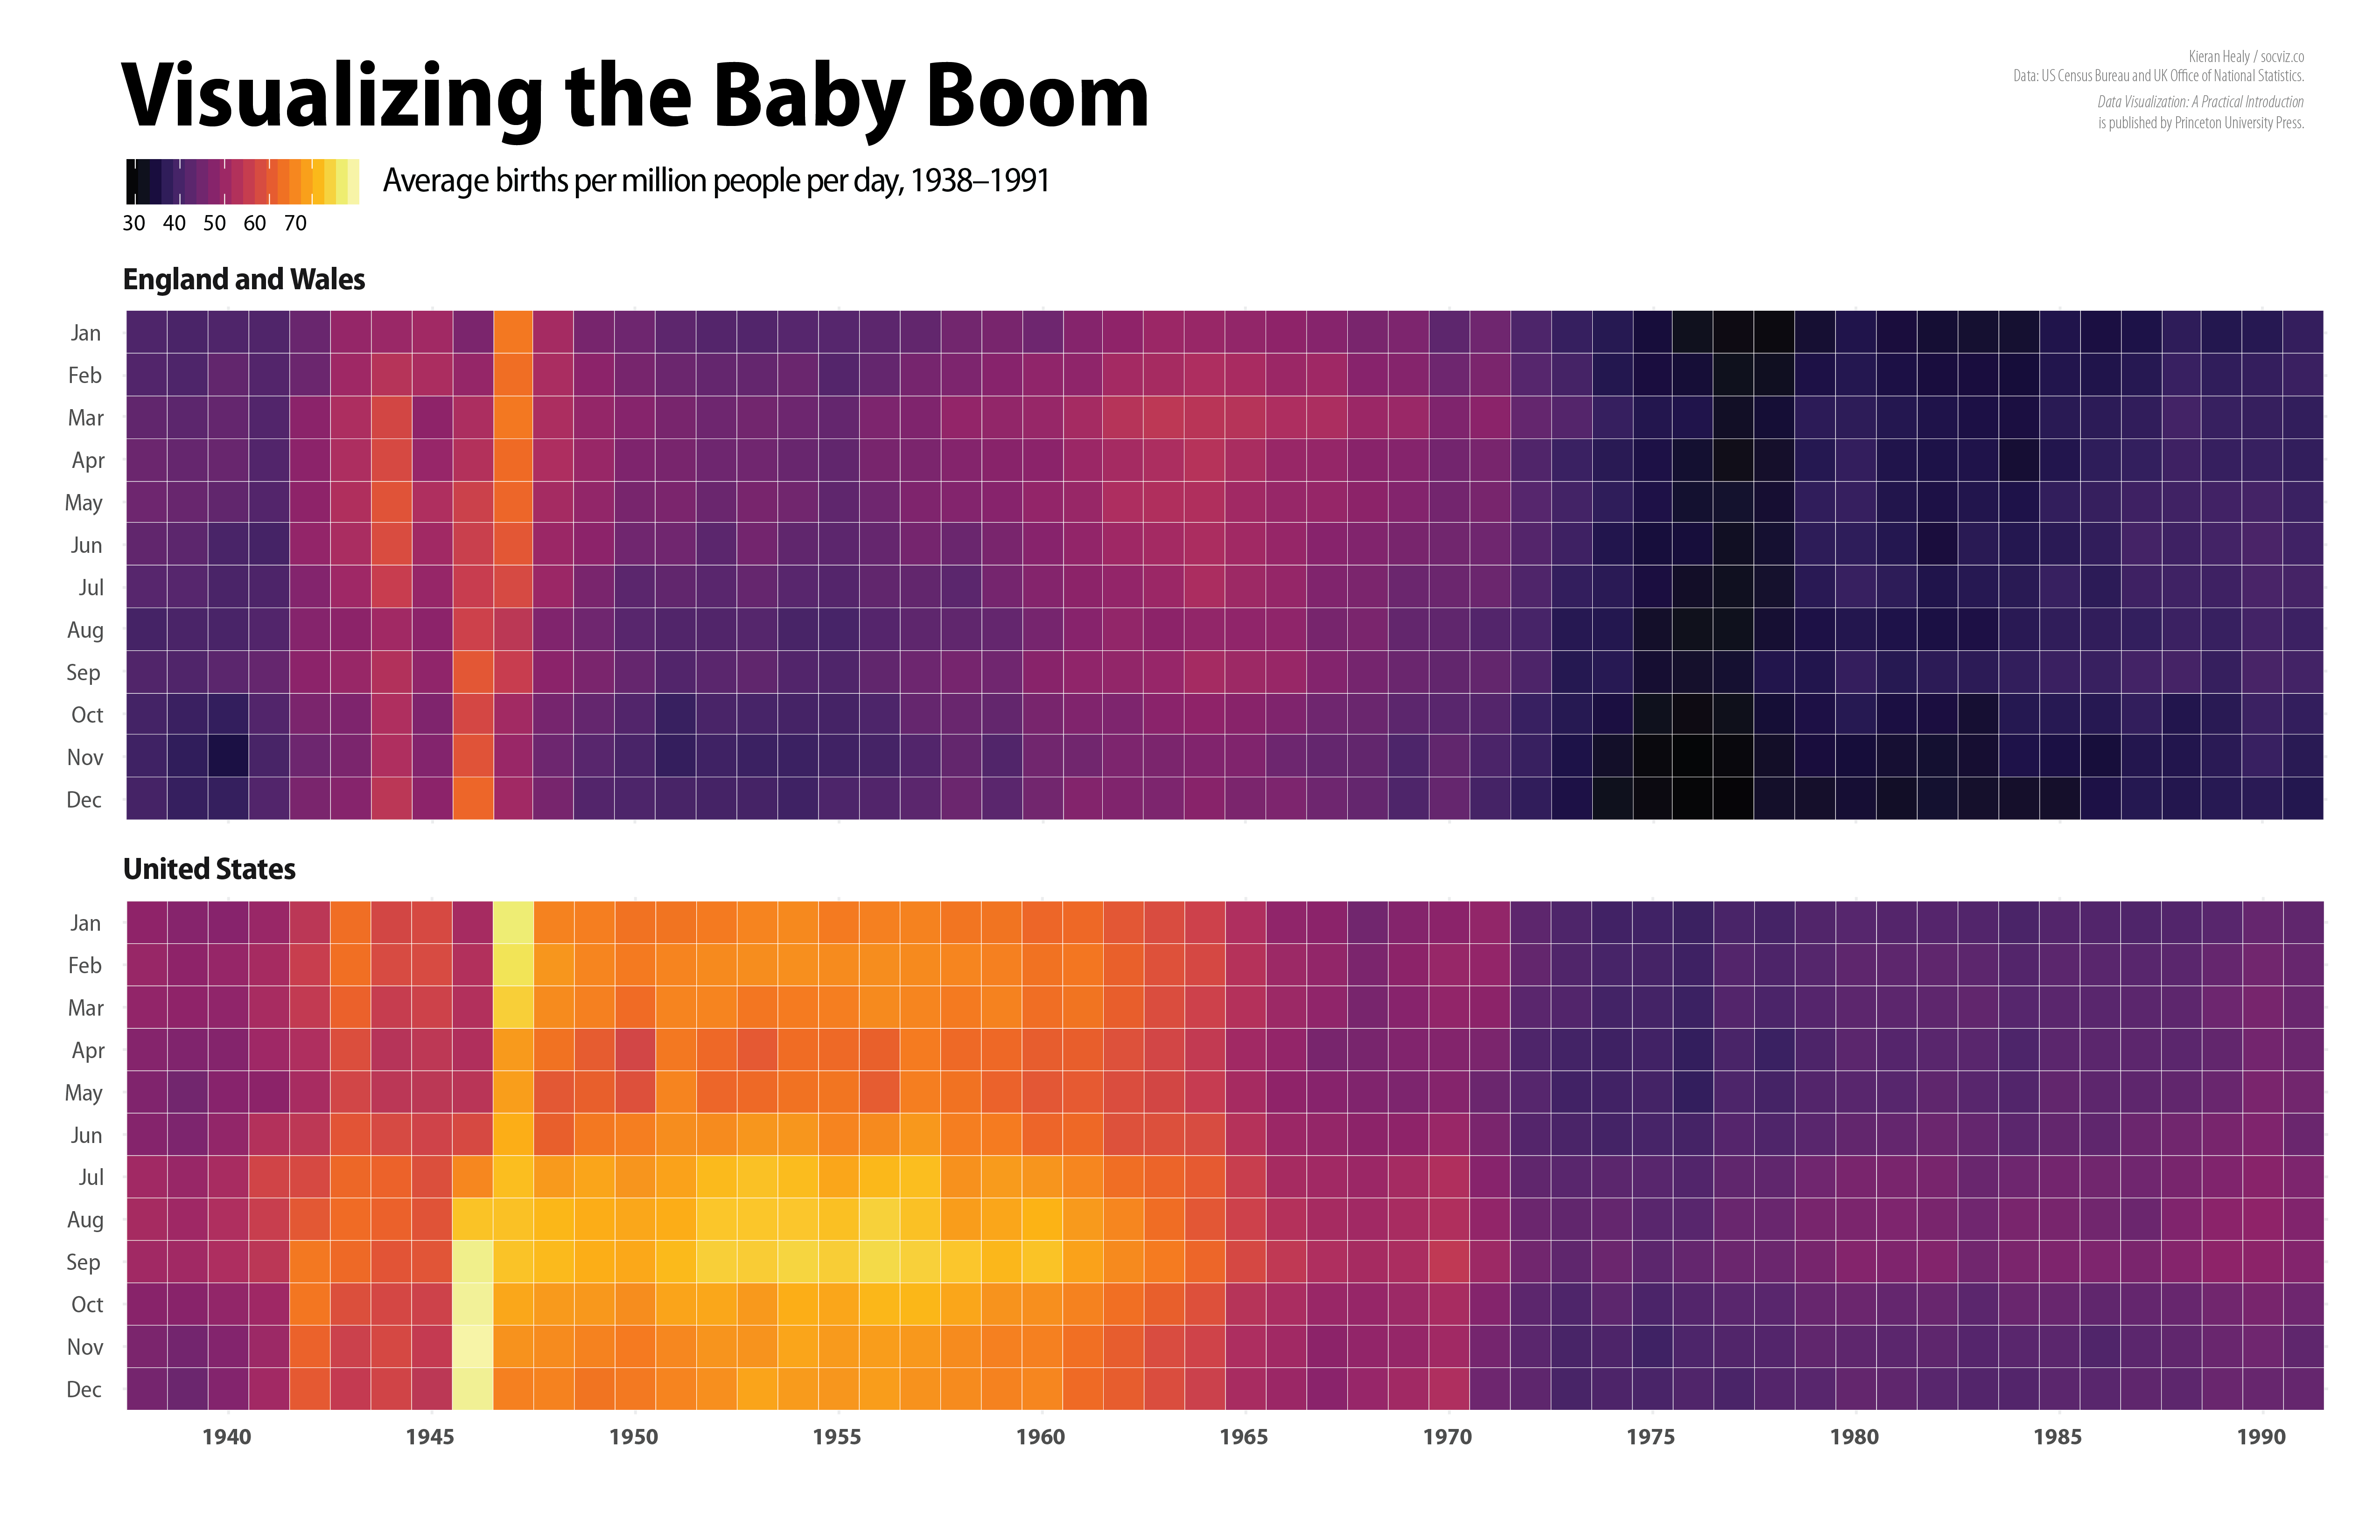
The Baby Boom in the US and the UK.