Resources
This page has links to configuration files, R packages, templates, and a few other things that might be of use to people who want to write (and give talks about) well-formatted social science papers using plain text tools.
Show and Tell
Data Visualization: A Practical Introduction →
 Data Visualization: A Practical Introduction is published by Princeton University Press. It introduces you to both the ideas and the methods of data visualization in a clear, sensible, and reproducible way, using R and ggplot2. It is accompanied by an R package containing supporting materials for teaching and learning, including a variety of datasets, convenience functions, and an R Studio project file containing all the code for each of the book's chapters.
Making Slides
 This is a short talk, originally given in my Departmental Proseminar, on the topic of giving presentations. I discuss how to think about your talk in general (and how to distinguish it from the paper you're taking about, on the one hand, and the slides you're showing people, on the other.) I then say some things about how to use slides to best get your point across.
Make and Do
The Plain Person's Guide to Plain Text Social Science →
 Available
either as booklet
or as a website. Note: This booklet is in need of revision because the
best available tools have improved or changed. But the ideas are still basically right. As a beginning
graduate student in the social sciences, what sort of software
should you use to do your work? More importantly, what principles
should guide your choices? This article offers some answers. The
short version is: you should use tools that give you more control
over the process of data analysis and writing. I recommend you write
prose and code using a good text editor; analyze quantitative data
with R or Stata; minimize error by storing your work in a simple
format (plain text is best), and make a habit of documenting what
you've done. For data analysis, consider using a format like
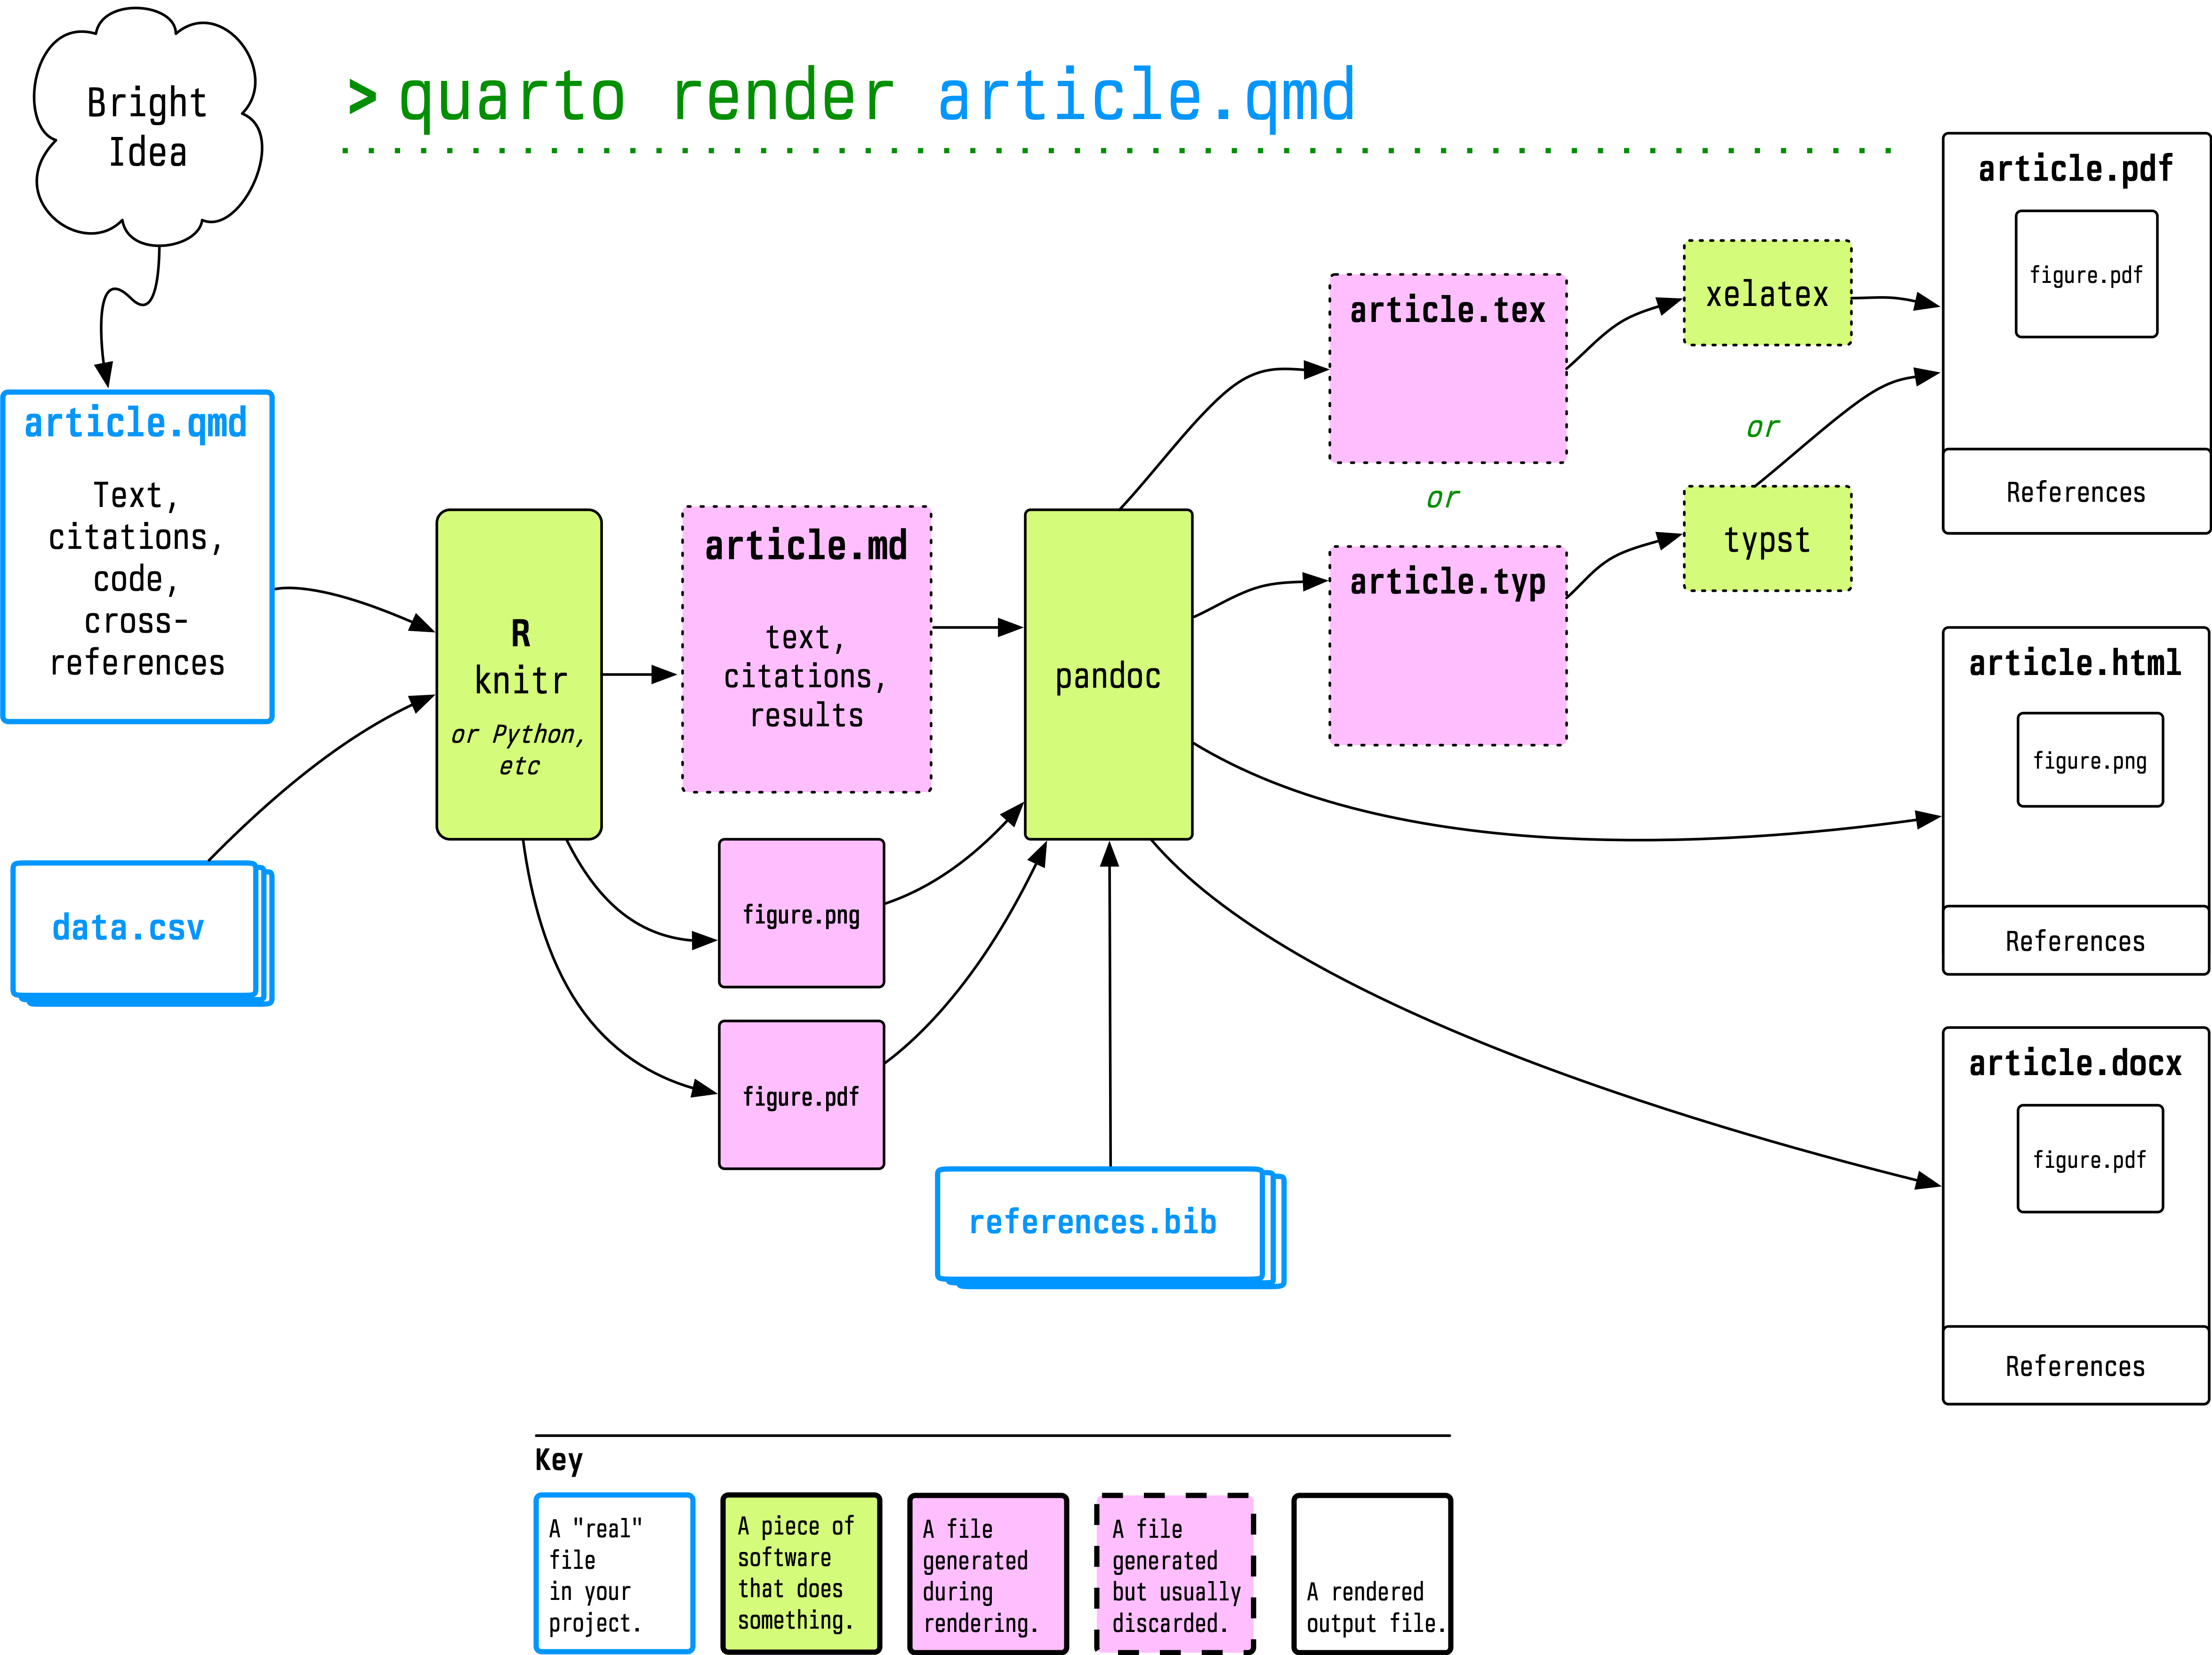
Rmarkdown and tools like Knitr to make your work more easily
reproducible for your future self. Use Pandoc to turn your
plain-text documents into PDF, HTML, or Word files to share with
others. Keep your projects in a version control system. Back
everything up regularly. Make your computer work for you by
automating as many of these steps as you can. To help you get
started, I briefly discuss a drop-in set of useful defaults to get
started with Emacs (a powerful, free text-editor), though I
emphasize that there are many other alternatives. I share some
templates and style files that can get you quickly from plain text
to various output formats. And I point to several alternatives,
because no humane person should recommend Emacs without presenting
some other options as well.
Available
either as booklet
or as a website. Note: This booklet is in need of revision because the
best available tools have improved or changed. But the ideas are still basically right. As a beginning
graduate student in the social sciences, what sort of software
should you use to do your work? More importantly, what principles
should guide your choices? This article offers some answers. The
short version is: you should use tools that give you more control
over the process of data analysis and writing. I recommend you write
prose and code using a good text editor; analyze quantitative data
with R or Stata; minimize error by storing your work in a simple
format (plain text is best), and make a habit of documenting what
you've done. For data analysis, consider using a format like
Rmarkdown and tools like Knitr to make your work more easily
reproducible for your future self. Use Pandoc to turn your
plain-text documents into PDF, HTML, or Word files to share with
others. Keep your projects in a version control system. Back
everything up regularly. Make your computer work for you by
automating as many of these steps as you can. To help you get
started, I briefly discuss a drop-in set of useful defaults to get
started with Emacs (a powerful, free text-editor), though I
emphasize that there are many other alternatives. I share some
templates and style files that can get you quickly from plain text
to various output formats. And I point to several alternatives,
because no humane person should recommend Emacs without presenting
some other options as well.
R Packages
The GSS
 Provides the complete General
Social Survey cumulative data file (1972-present) and panel data files for use in R. It also makes it convenient to pull the data files for individual survey years from the NORC website.
Provides the complete General
Social Survey cumulative data file (1972-present) and panel data files for use in R. It also makes it convenient to pull the data files for individual survey years from the NORC website.
 This is a companion to the gssr package. Integrates information about GSS variables into R's help/documentation system, so you can look up information on GSS variables as if they were functions.
NYC Packages
 Useful for teaching
dplyr, but also for drawing maps and for learning where New York City dogs live.
Useful for teaching
dplyr, but also for drawing maps and for learning where New York City dogs live.
 Informs you about the (given) names New Yorkers have.
 Informs you about what New Yorkers complain about.
 Provides sf objects of various New York City geographies (and associated tibbles of identifiers) for drawing thematic maps.
 Provides sf objects of NTA- and tract-level New York City geographies laid out as tessellated grids, with both hexagonal and square tiles. Let's you draw stylized thematic maps of the city where 1 tile equals 1 NTA or tract. The geometry column is named `tile_map` (rather than `geometry`) to allow you to have both stylized and geographically accurate geometries in the same sf object.
 Provides an sf object containing the New York City street centerline dataset from NYC Open Data.
 Provides sf objects from the New York City Digital City Map (DCM) for drawing street maps and working with NYC street data.
 Provides a tibble of New York City zip codes and a simple features collection of their ZCTA polygons.
 Spatial and tabular data describing the New York City subway system, derived from the MTA’s GTFS feed. Includes route shapes, stops, parent stations, directional platforms, transfers, and pre-computed offset versions of routes and stops suitable for schematic mapping.
 Downloads official New York City geographic boundary data and generates comprehensive crosswalk tables showing how administrative and spatial boundaries overlap. It produces both wide-format and long-format CSV crosswalks with intersection area and percentage calculations.
 Bare-earth digital elevation model for New York City, derived from the City’s 1-foot 2010 LiDAR data. The package ships mean-aggregated 50-foot and 100-foot GeoTIFFs masked to the borough boundaries, plus a small contour sf object for ggplot2 overlays.
Other
 The socviz package supports the Data Visualization book with a collection of datasets and utility functions to help you draw good graphs in R and ggplot.
 The uscenpops package contains a table of birth counts for the United States by year-of-age and sex for every year from 1900 to 2018.
 The covdata package contains data on COVID-19 from a variety of sources including cross-national data from the ECDC; U.S. state-level data from the CDC and the New York Times; patient-level data from the CDC; excess mortality data from the Human Mortality Database; and mobility data from Apple.
 The covmobility package is a companion to covdata and contains COVID-related mobility data released by Apple and Google.
Typographic Niceties
Pandoc Templates →
Some Pandoc templates meant to go in ~/.pandoc/templates. Point to them directly from the command line, use them with what's provided in latex-custom-kjh, or use them as part of a Markdown, RMarkdown, or Quarto workflow.
LaTeX Templates and Styles →
A collection of LaTeX style files, templates, and org-mode documents providing some nice layouts for typesetting articles using pdfLaTeX or XeLaTeX. They make a pipeline that, for example, lets you begin with an
.org file in Emacs (as set up in the Starter Kit), and go from there to a nice, fully-processed PDF in one step. Or the pieces can be used separately
to set up a .tex file with a nice Article layout. However, these days I almost never write anything directly in LaTeX. Instead, these templates form part of a pipeline that stars with a Markdown or RMarkdown file and ends up as a HTML, Word, or PDF document.
So You Like My Website →
This site is produced using Hugo, a very fast static site generator, which you can read more about here. I've written about my own experience setting it up, too, though the discussion there is now quite old. Fair warning: if you just want to set up a website with your research, contact information, and links to your publications, then there are many simpler and more straightforward options you should seriously consider instead.
So You Like My Vita →
Every few months I get an email asking to see the LaTeX markup that I use to generate my Curriculum Vitae. So, here it is. Feel free to adapt it yourself. If you make stylistic modifications, I encourage you to fork the project on GitHub and make them available to others in the same way.
All GitHub Repos →
Here is a full list of the various public code and data repositories that I have on GitHub. They range from the configuration and templating tools listed above to data visualization exercises and other bits of data analysis, mostly written in R.