Vaccination Beeplot
Last year I wrote about vaccination exemptions in California kindergartens, drawing on school-level data provided by the state of California about the number of kindergarteners with “personal belief exemptions” (or PBEs) that allow them not to be vaccinated. Today I came across a ggplot package called ggbeeswarm that’s designed to create a “beeswarm plot”, or a 1-D scatterplot with a bit of information about the density of the distribution. I had used geom_jitter to do something like this for one of my plots last year, but the geoms in ggbeeswarm are better. I revisited the vaccination data and redrew the plot. The code is at the end of the original repository.
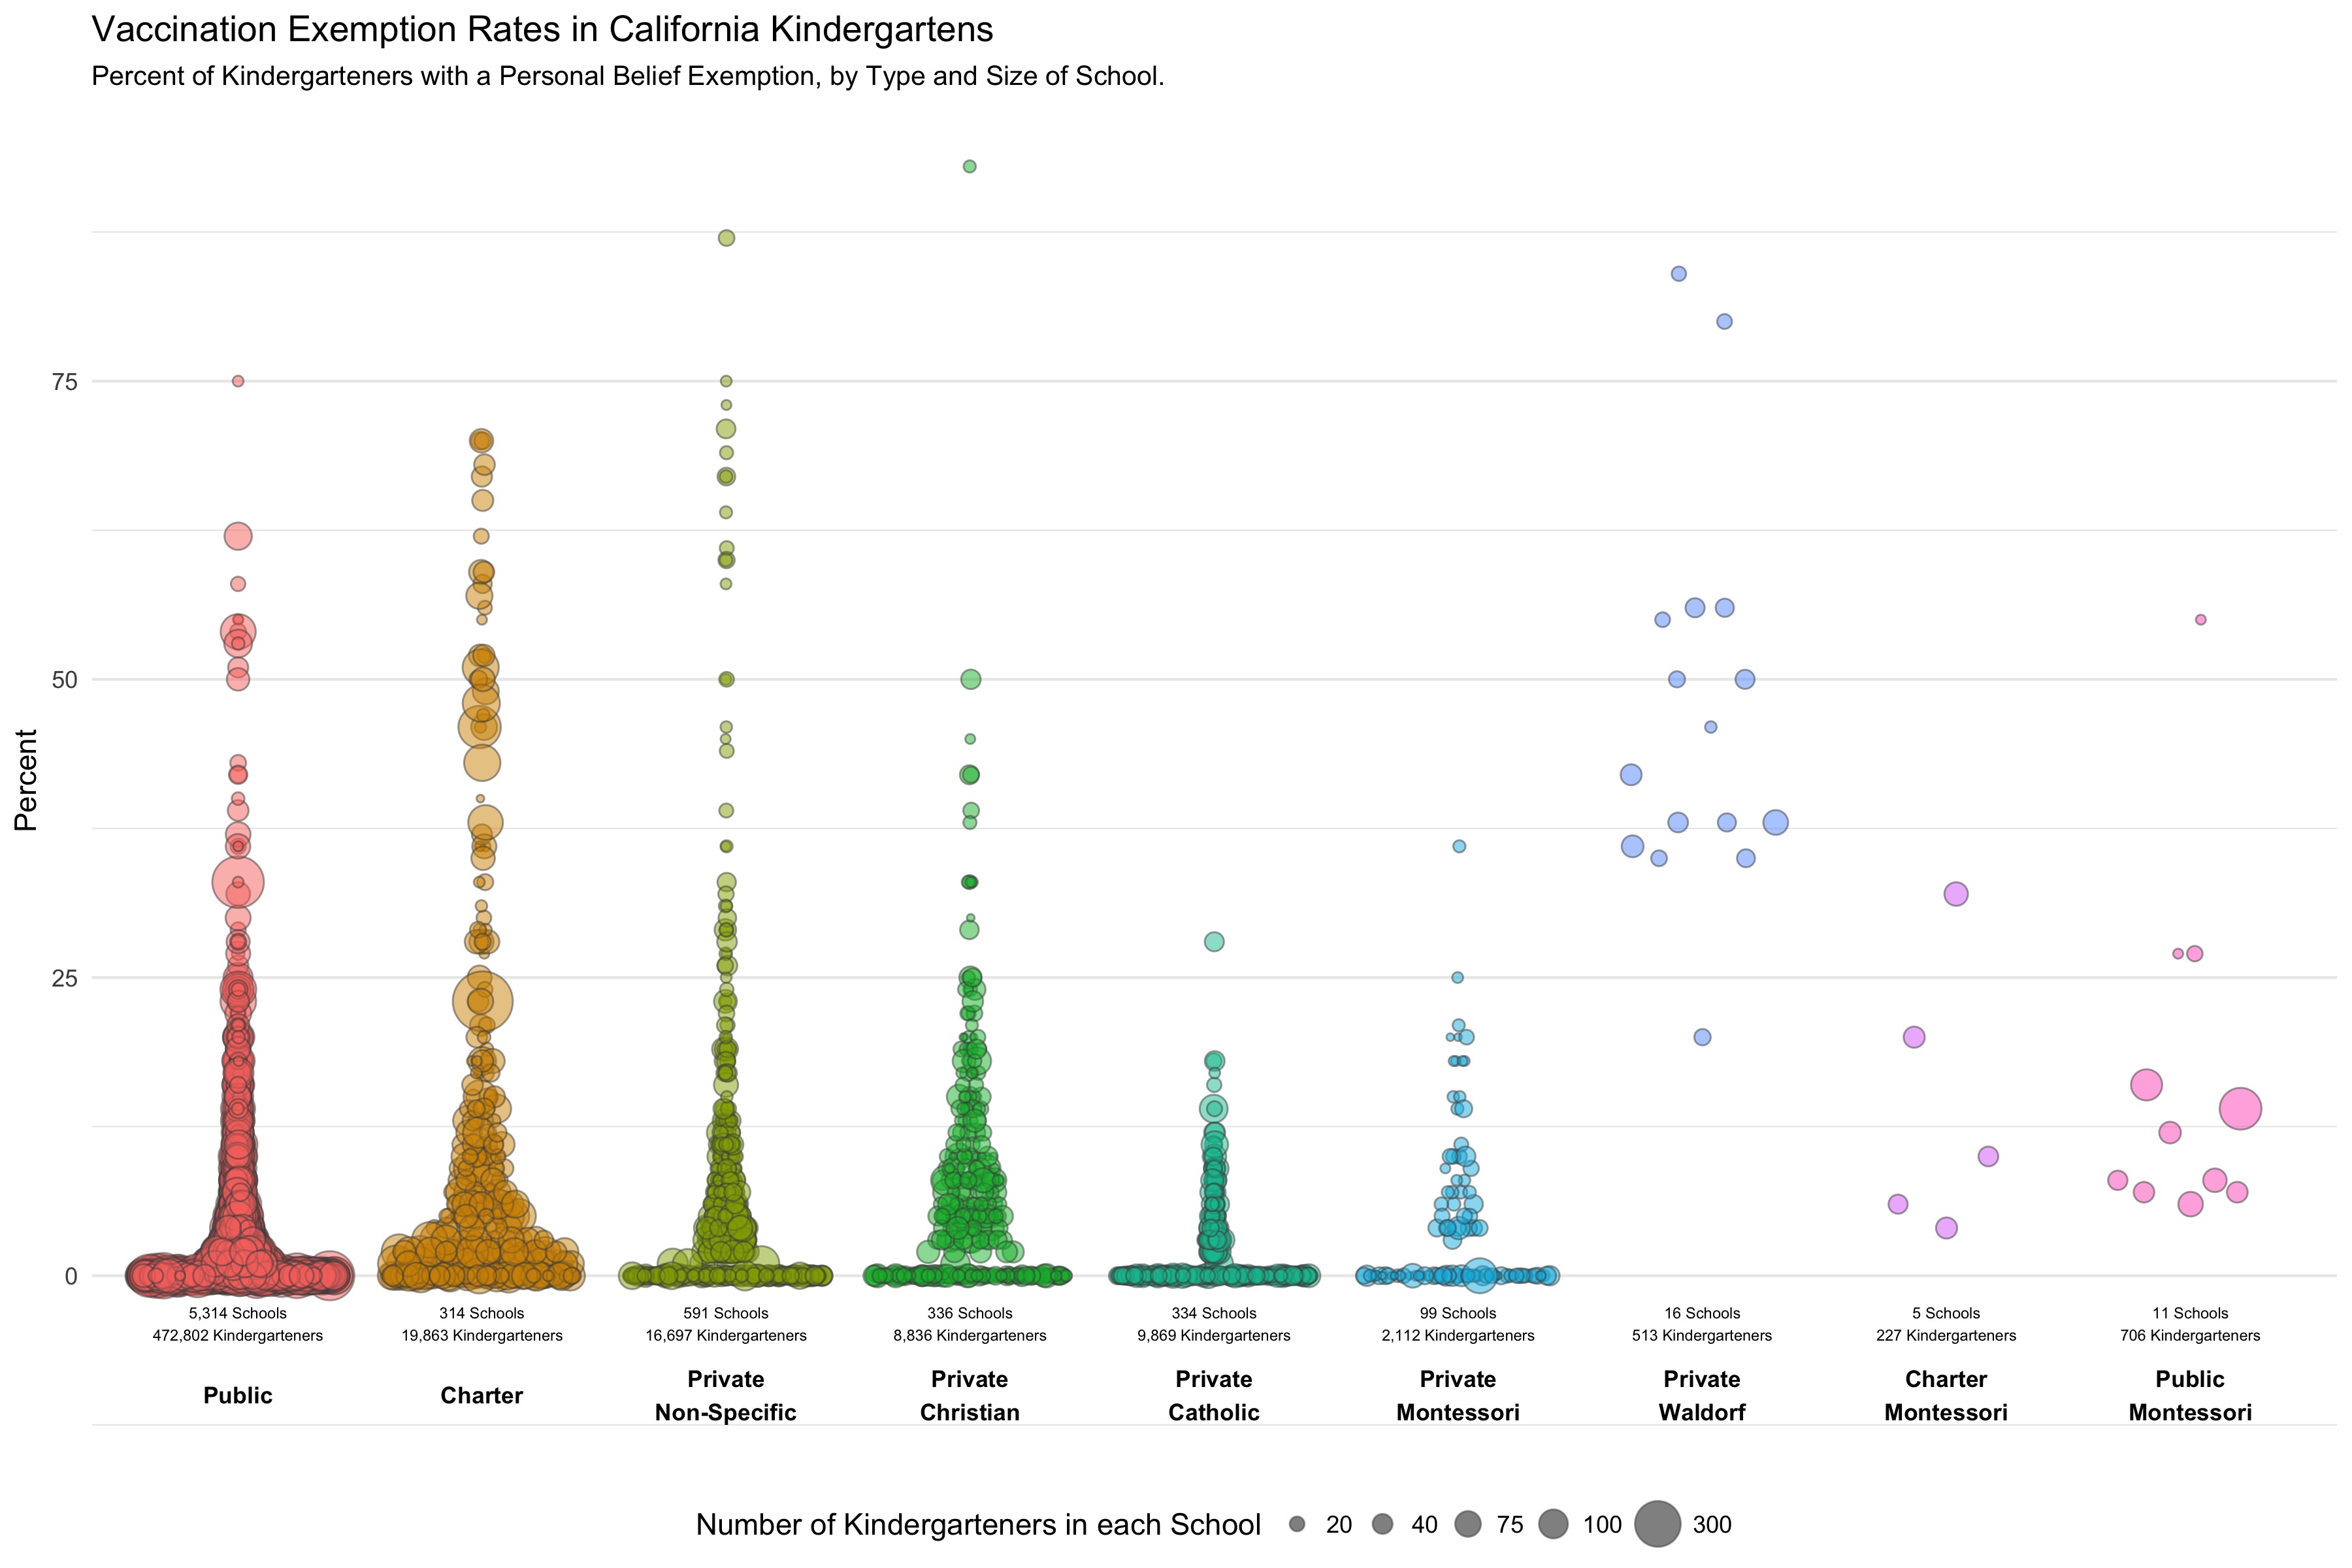
California Kindergarten PBE Rates by Type of School, 2014-15.
There’s a PDF available as well.
As a reminder, each circle is a school, and each circle shows kindergarten enrollments, not the overall school size.