The Federal Government Owns a Lot of Land
The current occupation of a federal wildlife refuge building in rural Oregon prompted me to make a map of the land owned or administered by the US government. There are a few such maps floating around, but I wanted to see if I could draw one in R. The US Geological Survey makes a shapefile available containing the boundaries of federal lands, so I grabbed that and simplified the category codings a bit, to make the main classes of land a bit more tractable. As the USGS page says,
The Federal Lands of the United States map layer shows those lands owned or administered by the Federal Government, including the Bureau of Land Management, the Bureau of Reclamation, the U.S. Department of Agriculture Forest Service, the Department of Defense, the U.S. Fish and Wildlife Service, the National Park Service, the Tennessee Valley Authority, and other agencies. Only areas of 640 acres or more are included. Descriptive information includes the name and type of the Federal land and the administering agency. There may be private inholdings within the boundaries of the Federal lands in this map layer. The map layer does not include linear (long, relatively narrow) features; these are available in a separate map layer … Federal wilderness area information is included in this map layer and also in The National Map Small-Scale Collection National Wilderness Preservation System of the United States map layer. Indian lands, administered by the Bureau of Indian Affairs, are available in the Indian Lands of the United States map layer.
That last point about Indian Reservations is worth noting, as there are some large reservation areas that aren’t classed as Federal Land. Some smaller Native American areas are included in this map layer as federally administered—here they’re classed under “Other”, as they’re not a very large proportion of the total.
Here’s the map.
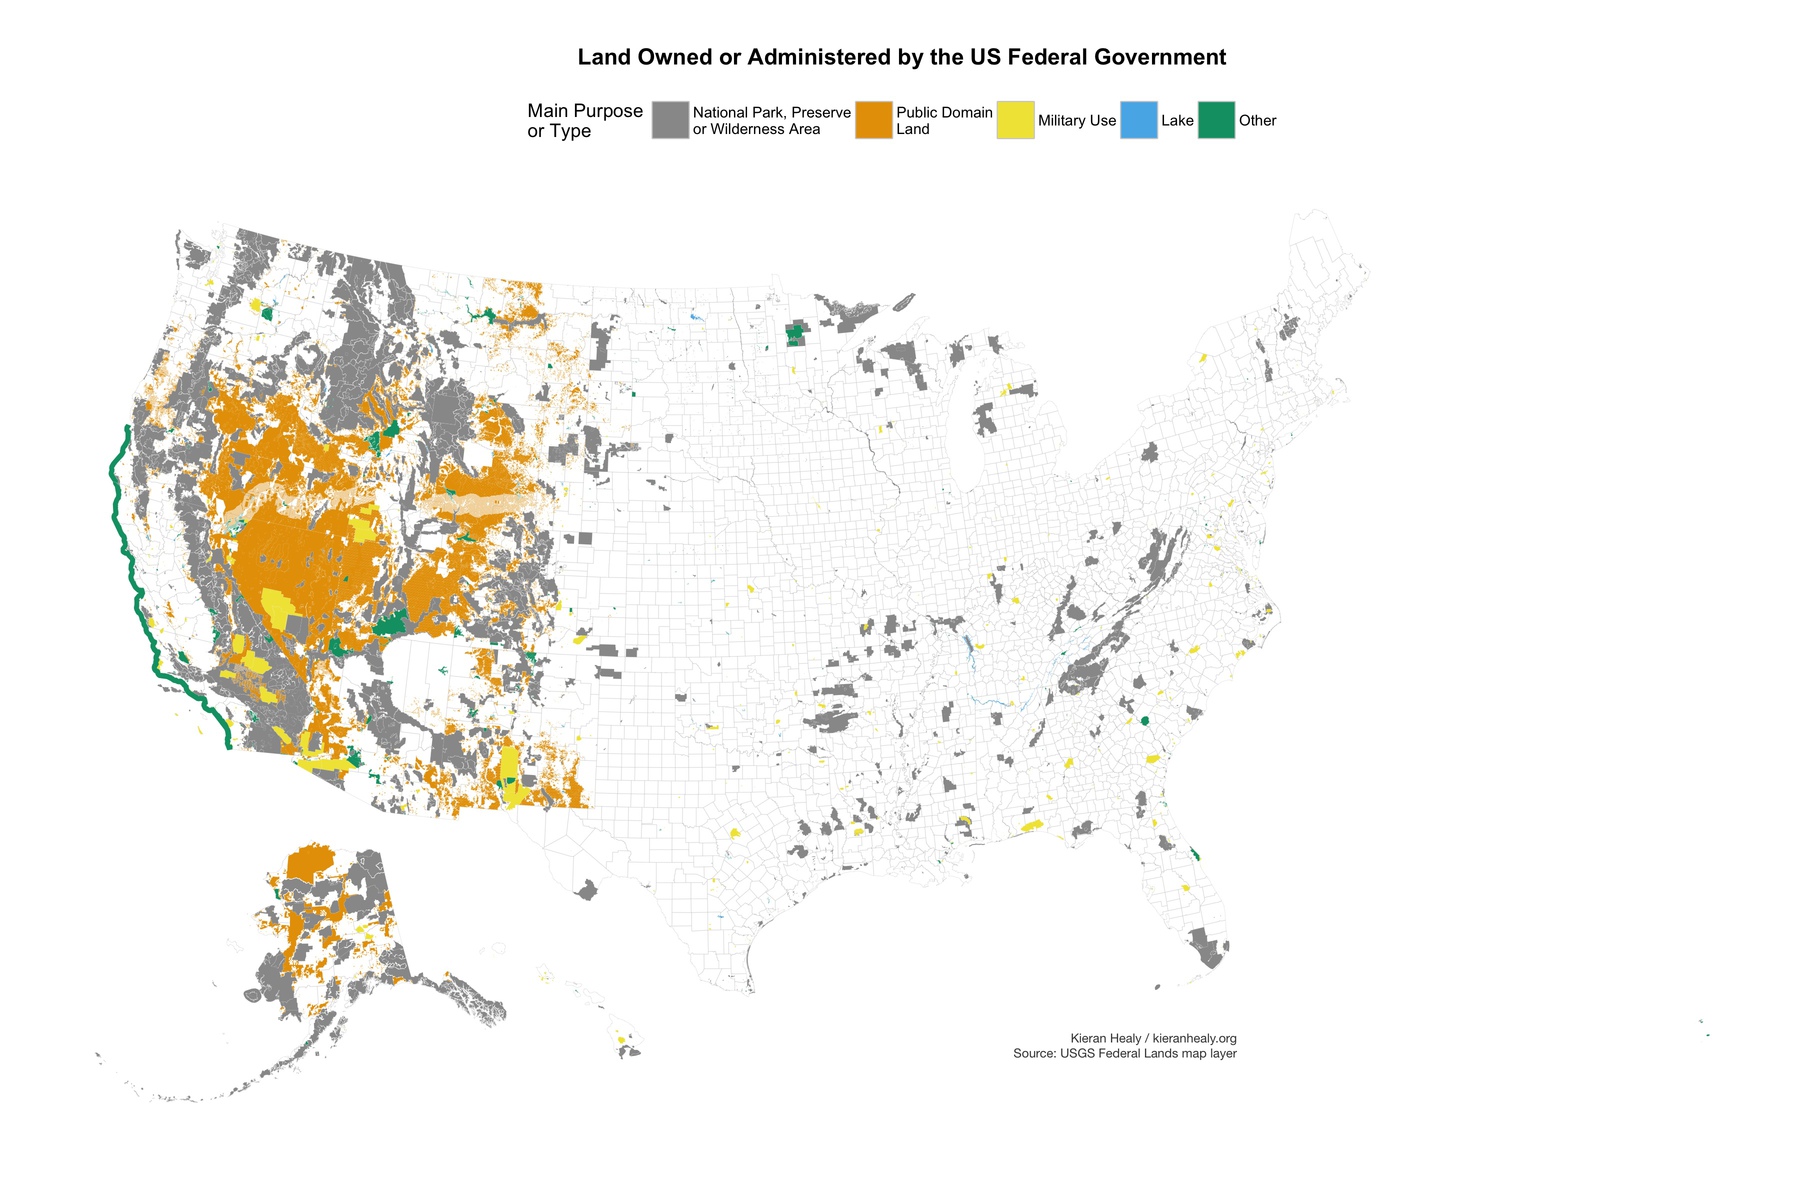
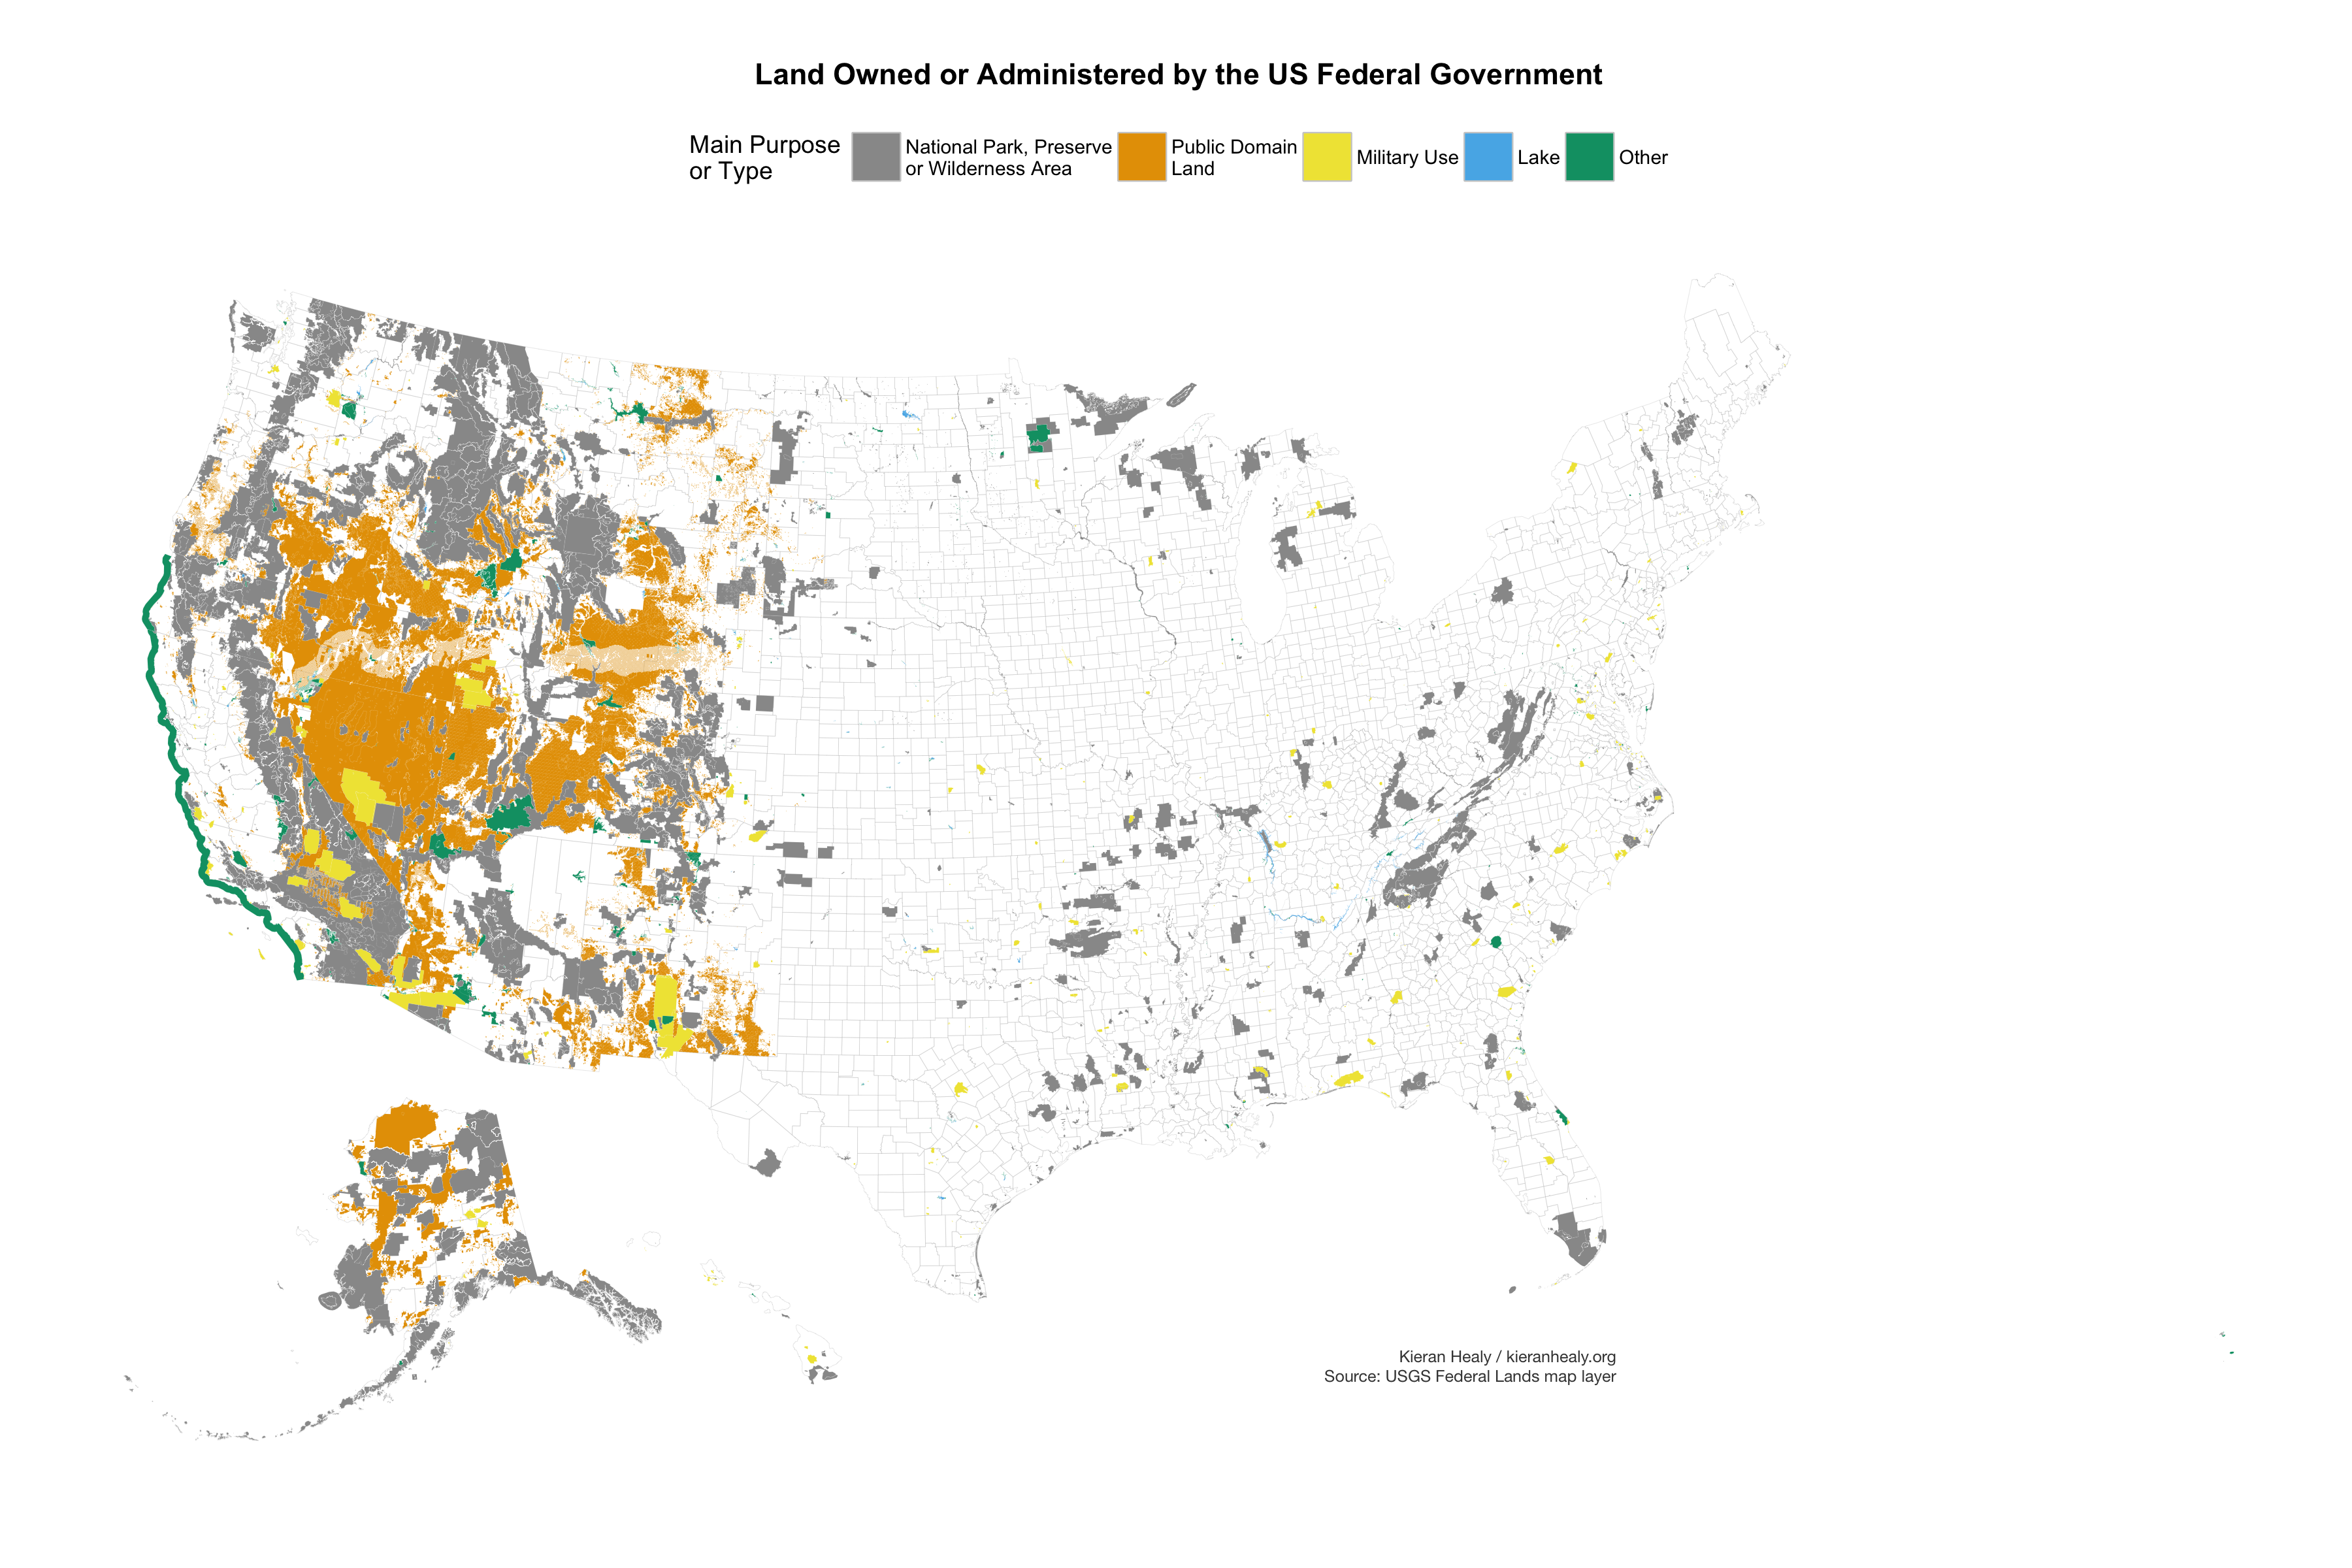
Land owned or administered by the US Federal Government.
(A PNG file is also available.)
The federal government owns a lot of land in the West, most of it being Public Domain Lands or one of the many kinds of National Park, Preserve, Forest, Wilderness, or Wildlife Refuge Areas that exist. Things are a lot patchier east of the Rockies, although there are substantial tracts of National Park and Forest there as well. Not all unmarked land is privately owned—I imagine State governments and agencies own or administer a reasonable amount of property—but the Feds are very much absent in places like Texas, Kansas, Iowa, and Nebraska. The US Military have large holdings as well—I recognize the rough U-Shape of the Yuma Proving Ground and Barry M. Goldwater Bombing Range from when I lived in Tucson.
This map collapses a larger number of use categories to make it easier to see the main patterns. There are a couple of other ways one could look at it. First, we can break out the categories one at a time, like this. This might matter to us, for example, because the economic status of National Forest is different from that of a National Park or a National Wildlife Refuge. Here’s what some of those single uses look like.
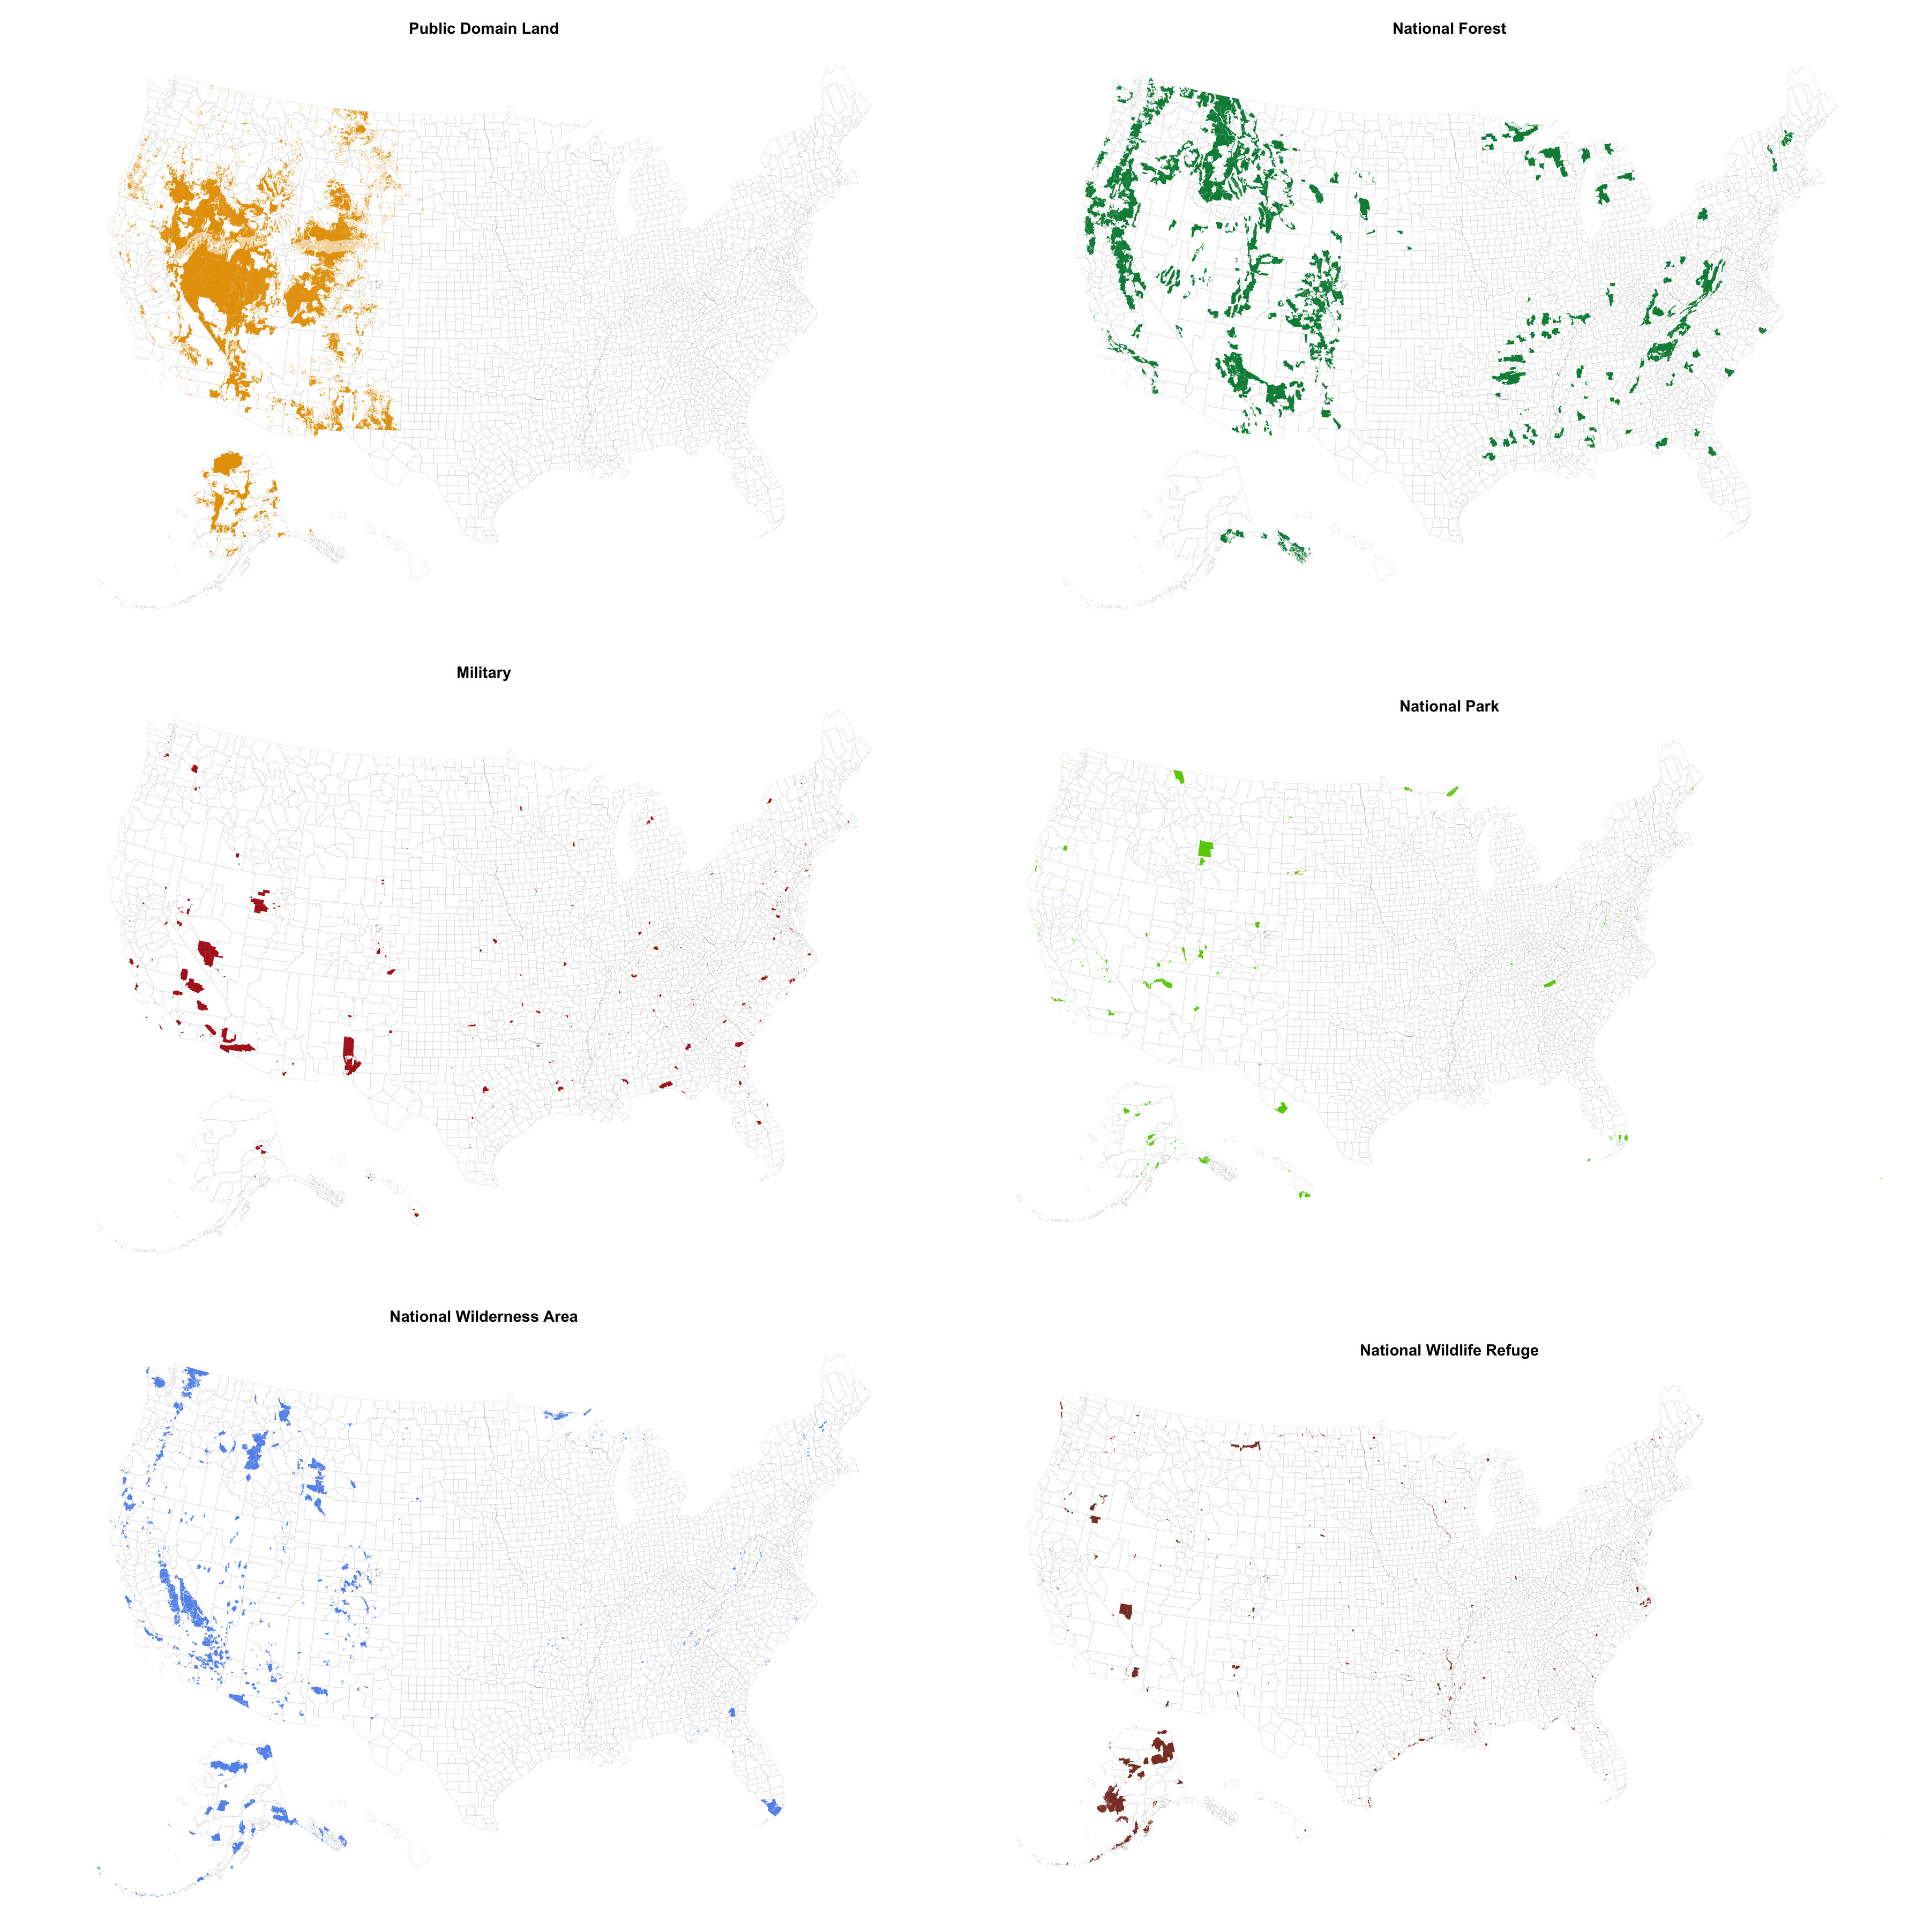
Federal Land by Selected Use Types.
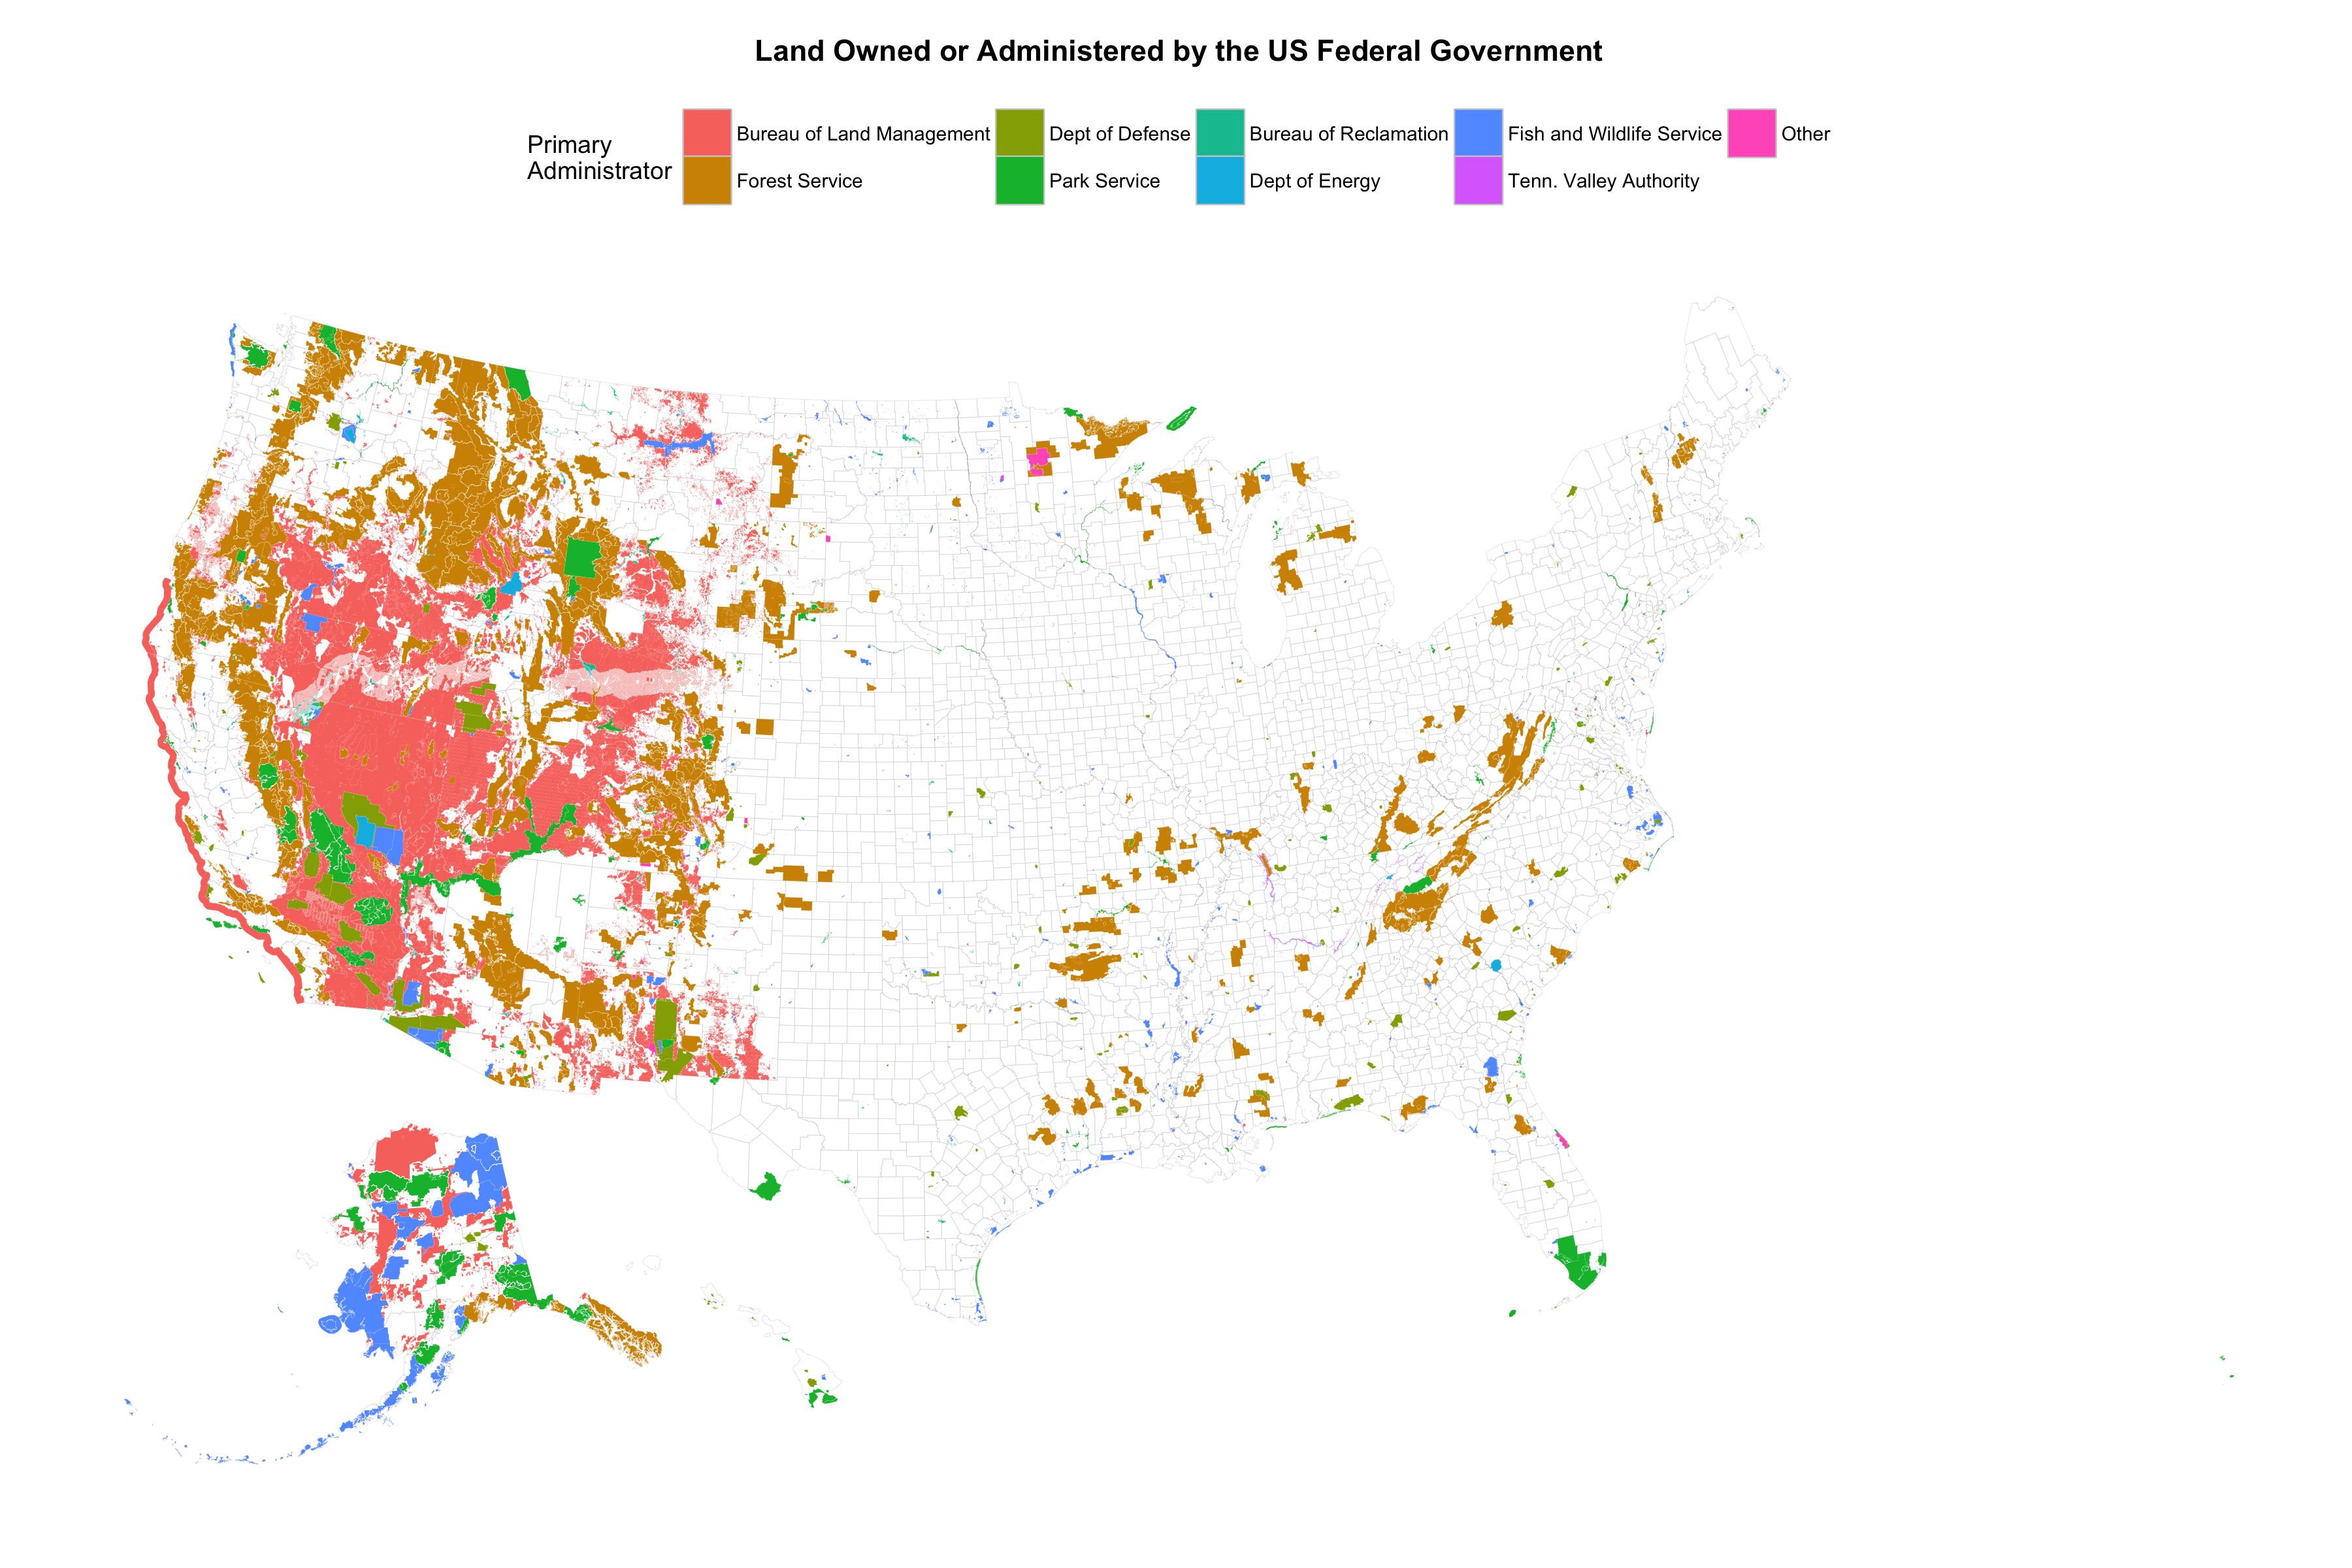
Alternatively, we can label the land categories not by use type but rather by the federal agency primarily responsible for them. Here is what that looks like. Again, we collapse some categories for agencies controlling relatively small areas.

Federal Land by Primary Agency Responsible.
(A PNG file is also available.)
One final point. A few months ago I drew a couple of maps I called “America’s Ur-Choropleths”, where the idea was that most of the choropleth maps of the US that you see are expressible as some combination of Population Density and Percent Black, the two basic features of US demographic geography. As you can see, the Feds mostly control land where nobody lives:
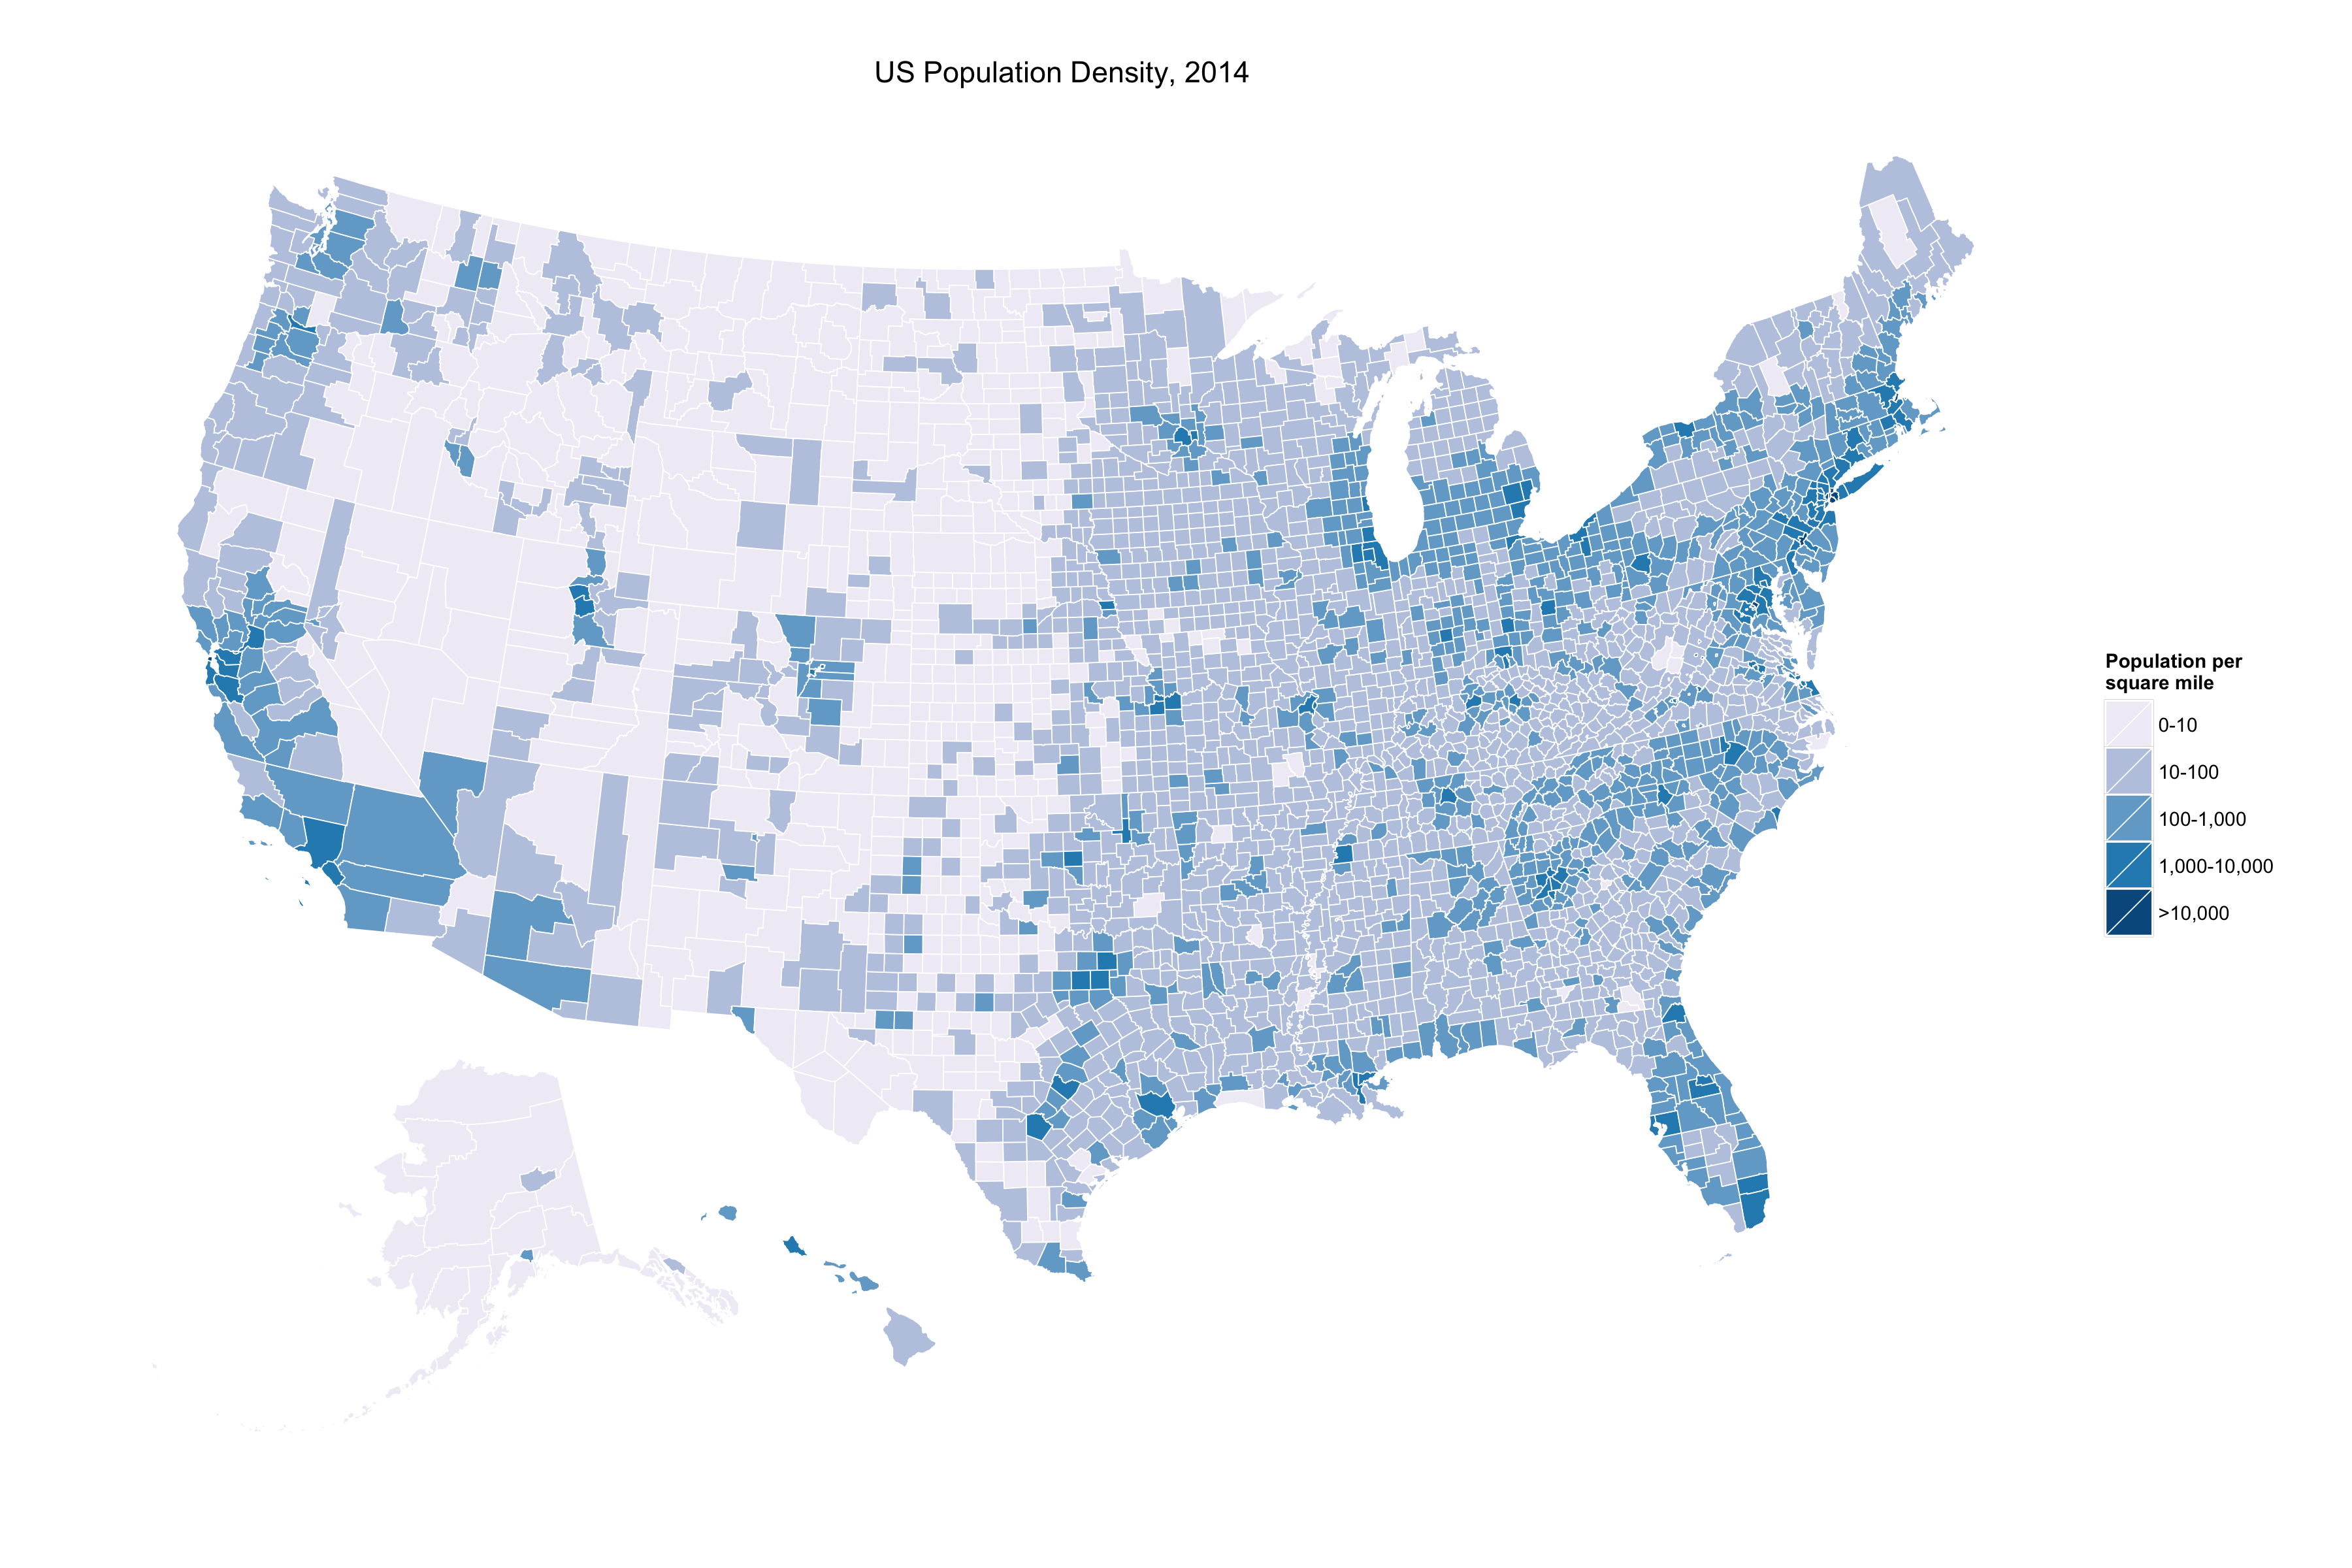
US Population Density Estimates, by county, 2014. Source: US Census.
It’d be a nice exercise, I think, to produce a standard map of something like the US Election results, where you see swathes of a single color in very sparsely-populated areas, but then overlay it with the Federal Lands map in way that treated those areas as something like inland seas in the manner of the Great Lakes.
The code to produce these maps is available on GitHub. Note that the land-use shapefile is too large to store on GitHub, so you’ll have to download it yourself. The instructions are in the R code.