A New York City Race and Ethnicity Dotmap
As promised in the previous installment, where we drew a dot-density map of New York City’s population, I did the same again only coloring it by the race and ethnicity reported by respondents in the 2020 Census. The direct comparison for this map are the block-level race and ethnicity choropleths I drew the other day. The data source is the same, it’s just that now we use it to make a dot map with a point for every ten people (on average, we round to the nearest ten) of a particular racial or ethnic group in a given Census block unit. As before we use the current Census categories. We have “racial” categories of White, Black, Asian, and Other. The latter collapses the Census categories “Native Hawaiian and Other Pacific Islander”, “American Indian and Alaska Native”, and “Some Other Race” where the numbers are too small to appear on this map. Meanwhile we separately track those reporting “Two or More Races”. The Census breaks this out into further multiracial categories but here we just code “Two or More” as “Multiracial”.
Meanwhile, we have to cross-classify the race categories with responses to the “Hispanic or Latino” question. In the Census’s schema, Hispanics may be of any race. (Again, there is an extensive literature on why things are like this in the Census and how it continues to change.) For the purposes of this map it makes sense to try to show racial and Hispanic/Latino categories jointly for larger groups. So we end up with nine categories. As you can see on the map, many people reporting themselves to be Hispanic/Latino will also say they are “Some other race”. Smaller proportions of Hispanic/Latino respondents will identify as White or Black alone.
Here’s the map.
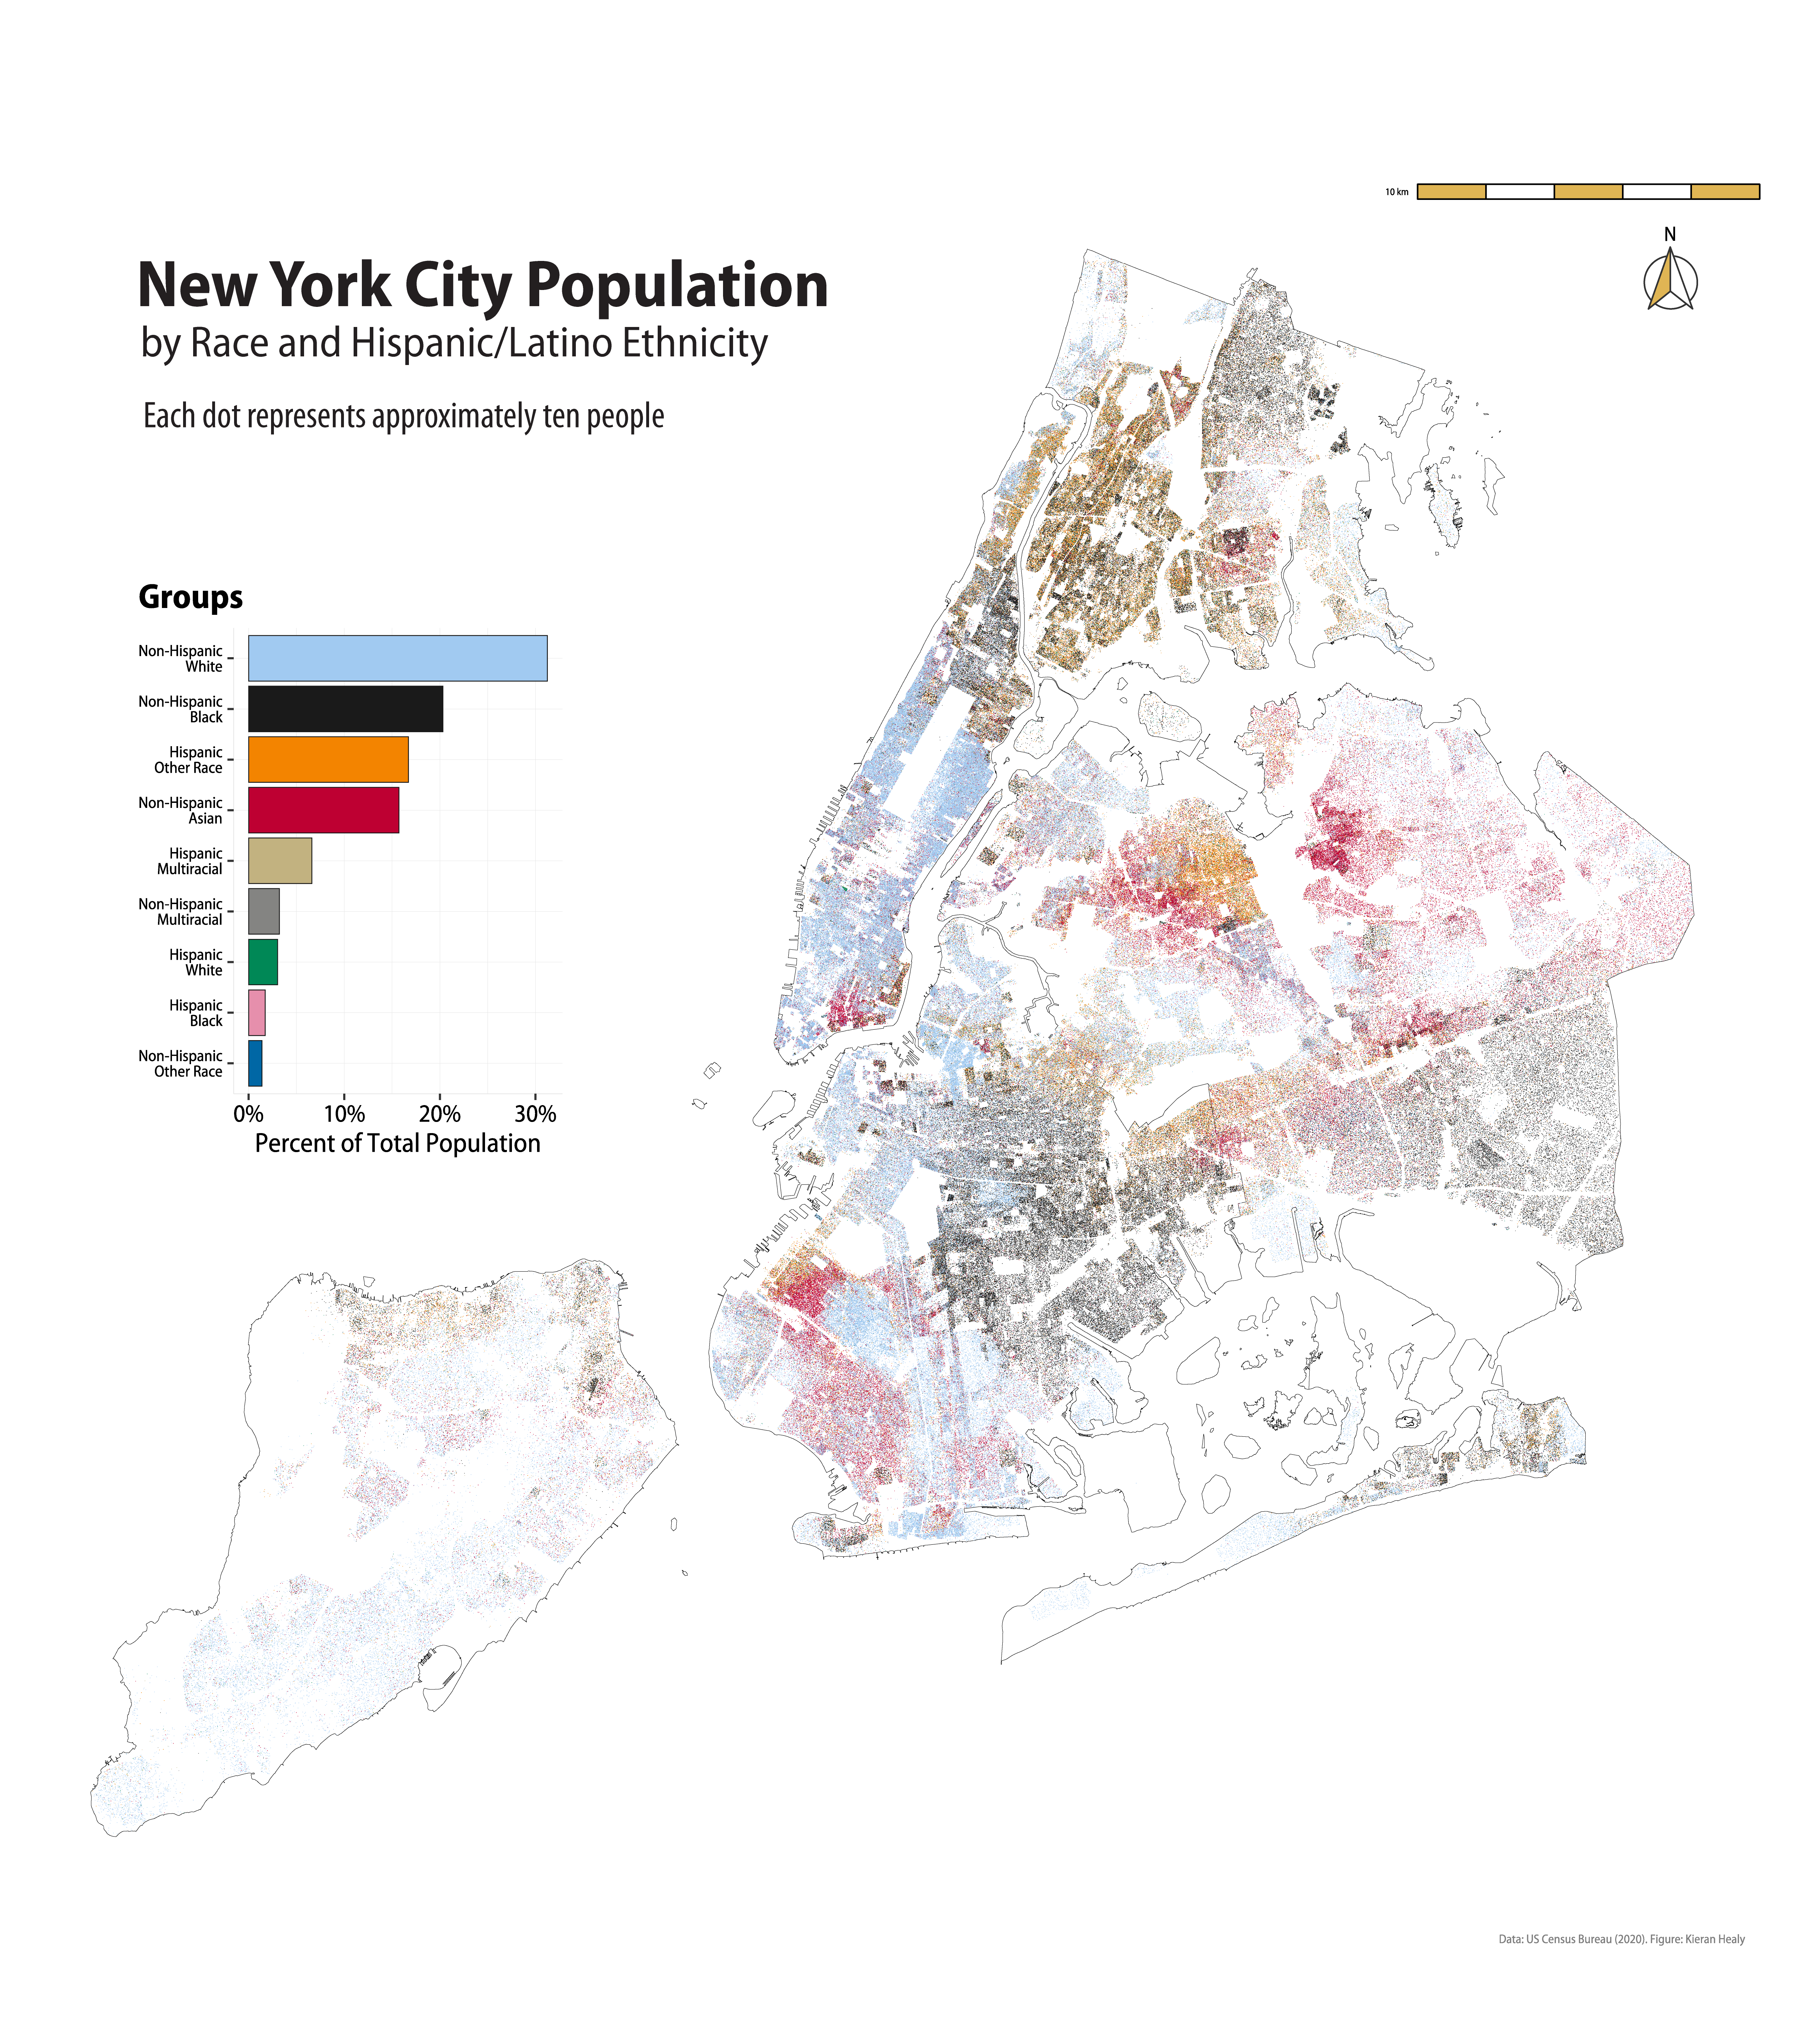
Dot-density map for New York City’s population by race and ethnicity.
There’s also a higher-resolution PNG version which is about 20MB in size.
As before, this map was made with R along with the ggplot2, tidycensus and sf packages (primarily). Some post-processing in Illustrator was a good lesson in how to make a really quite powerful computer run very slowly indeed.