Assault Deaths in the OECD 1960-2020
While we’re redoing some classics, here is the time series of assault deaths in the United States and eighteen other OECD countries from 1960 to 2020. Again, this is the sort of plot that you could choose to draw in a variety of ways depending on what it was that you wanted to emphasize. Code and data for this way of doing it are available on GitHub.
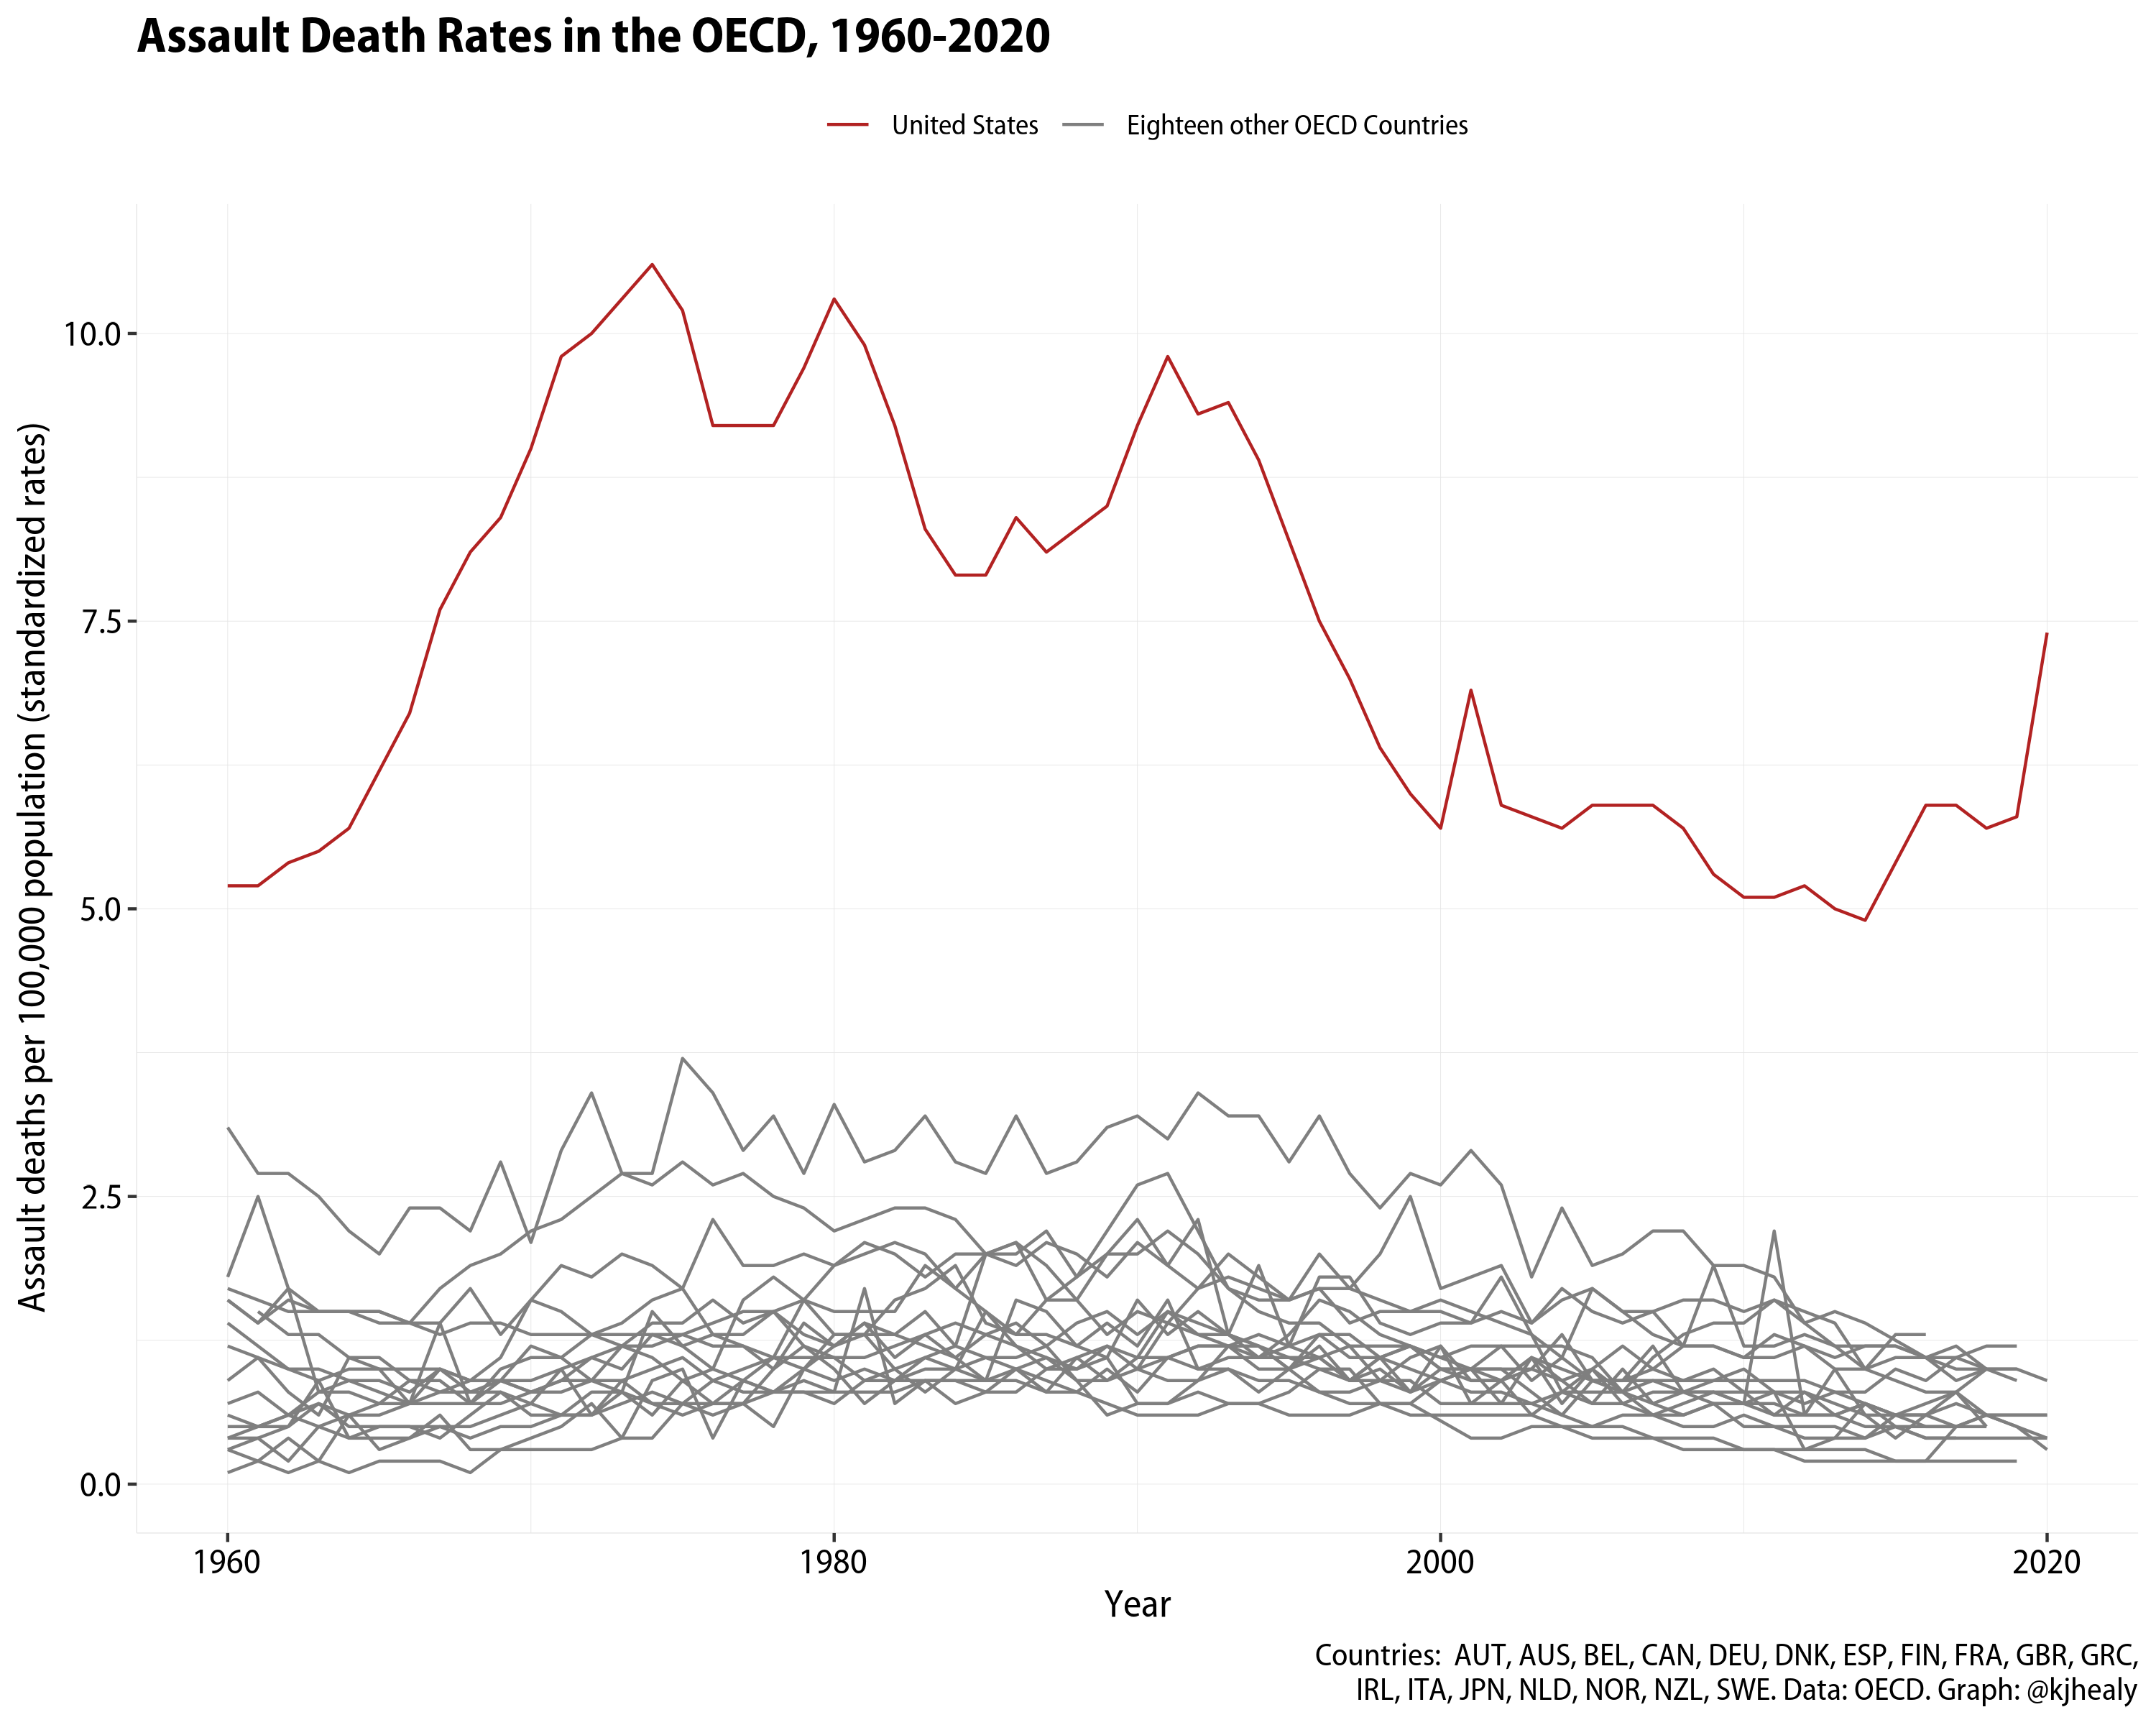
Assault deaths in the OECD, 1960-2020.