U.S. Census Counts Data
As promised previously, I packaged up the U.S. Census data that I pulled together to make the population density and pyramid animations. The package is called uscenpops and it’s available to install via GitHub or with install.packages() if you set up drat first. The instructions are on the package homepage.
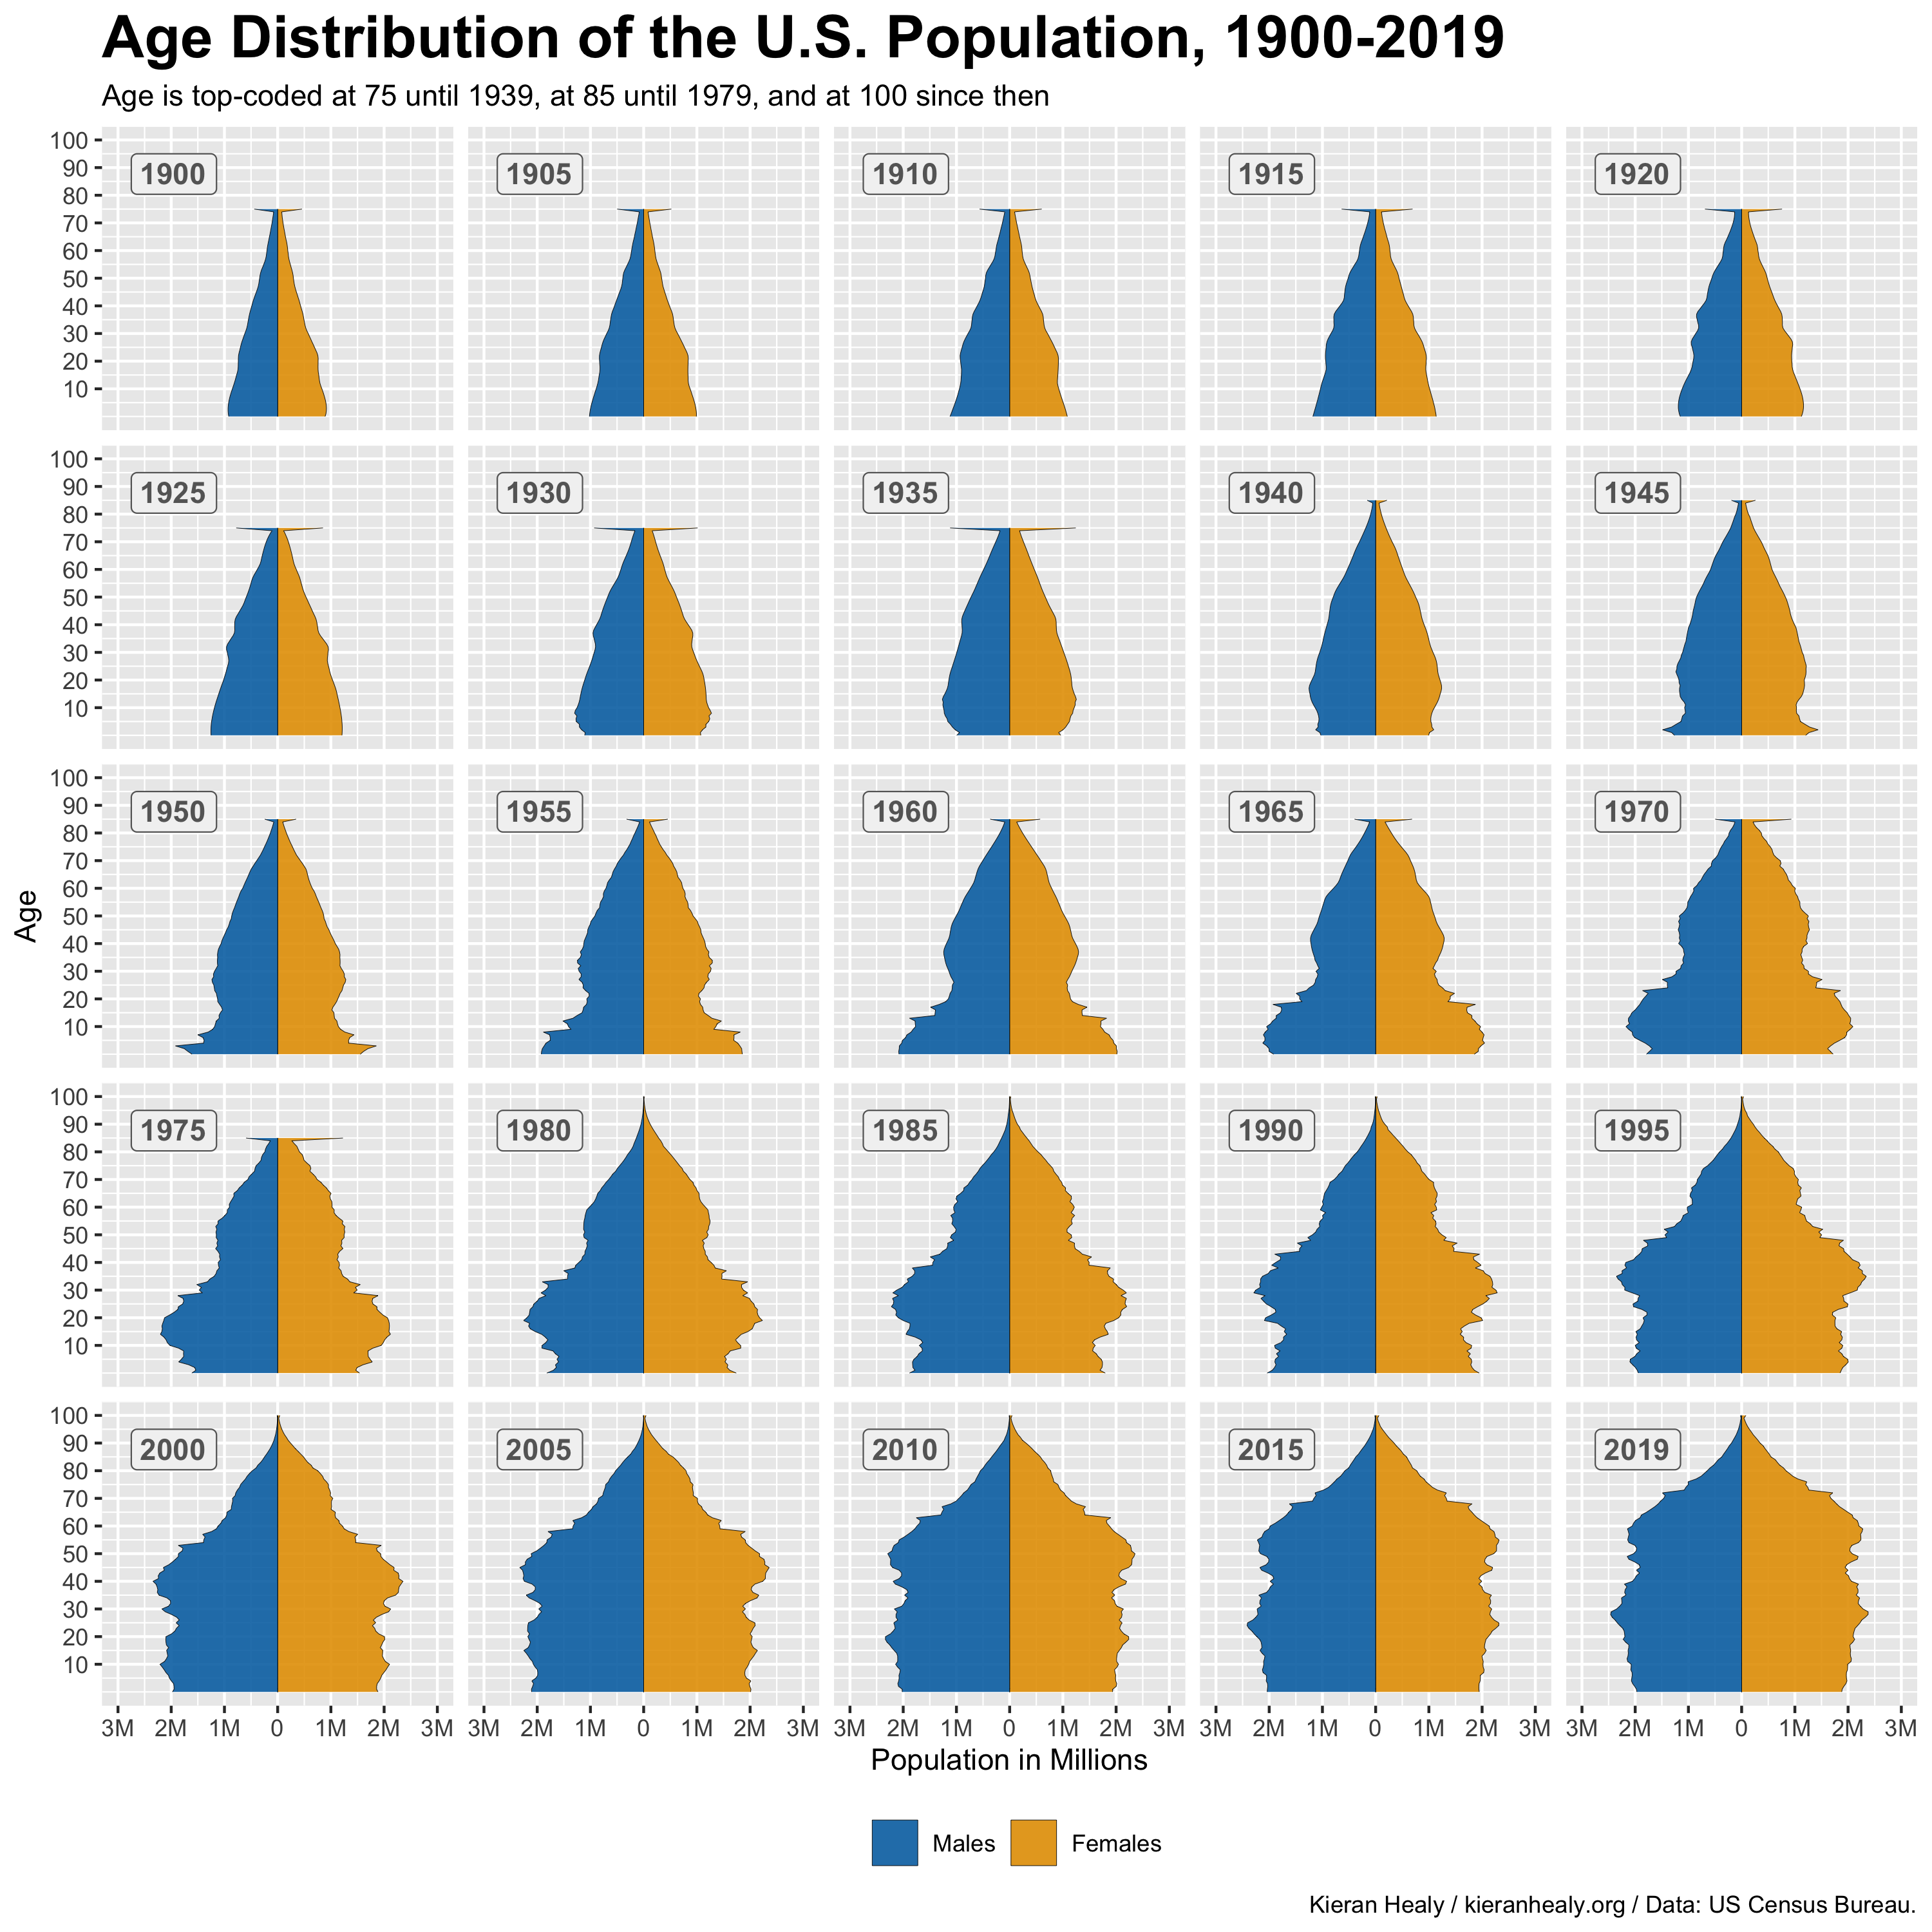
A small multiple plot of selected population pyramids
Instead of an animation, let’s make the less-flashy but, frankly, in all likelihood more useful small multiple plot seen here. With the package installed we can produce it as follows:
|
|
That’s what the dataset looks like. We’ll lengthen it, calculate a relative frequency (that we won’t use in this particular plot) and add a base value that we’ll use for the ribbon boundaries below.
|
|
Next we set up some little vectors of labels and colors, and then make a mini-dataframe of what we’ll use as labels in the plot area, rather than using the default strip labels in facet_wrap().
|
|
As before, the trick to making the pyramid is to set all the values for one category (here, males) to negative numbers.
|
|
The calls to geom_ribbon() and geom_label() draw the actual plots, and everything else is just a little attention to detail in order to make it come out nicely.