Asa Section Demographics
The American Sociological Association released some data on its special-interest sections, including some demographic breakdowns. Dan Hirschman wrote a post on Scatterplot looking at some of the breakdowns. Here are some more. I was interested in two things: first, the relative prevalence of Student and Retired members across sections, and second the distribution of women across sections. About 53% of all ASA members are women, substantially higher than some other social sciences and many other academic disciplines. Membership in sections is entirely voluntary and driven mostly by substantive research interests. It’s interesting to ask how people sort themselves across areas. (A tiny number of members do not belong to any sections.)
First, students and retirees.
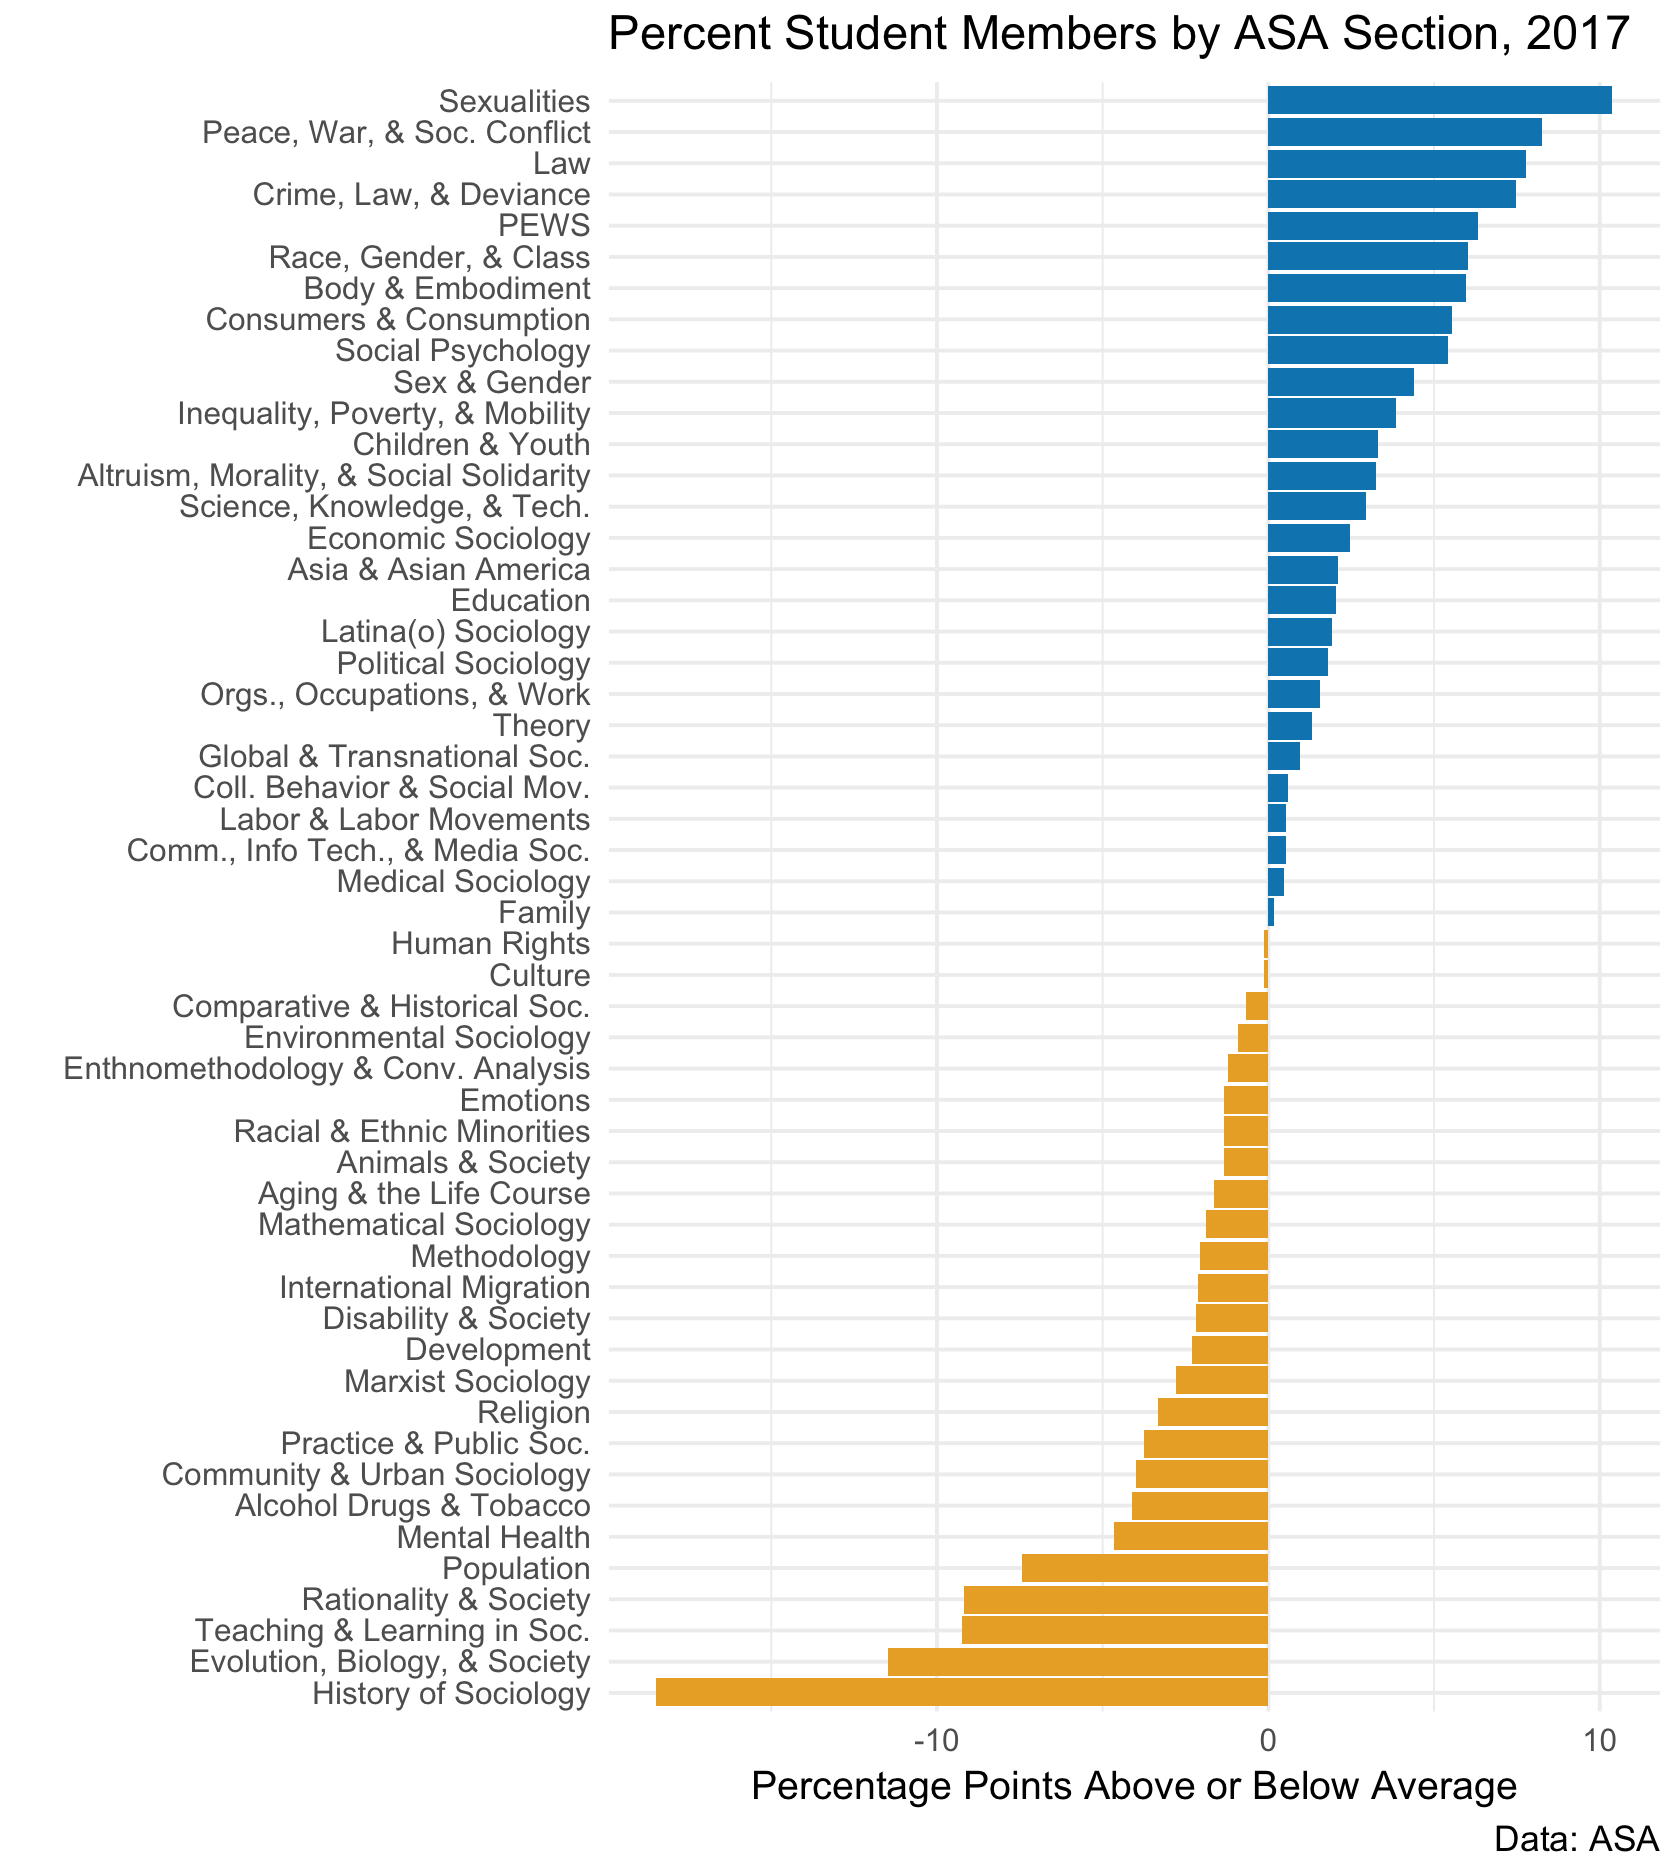
Concentrations of Student Members.
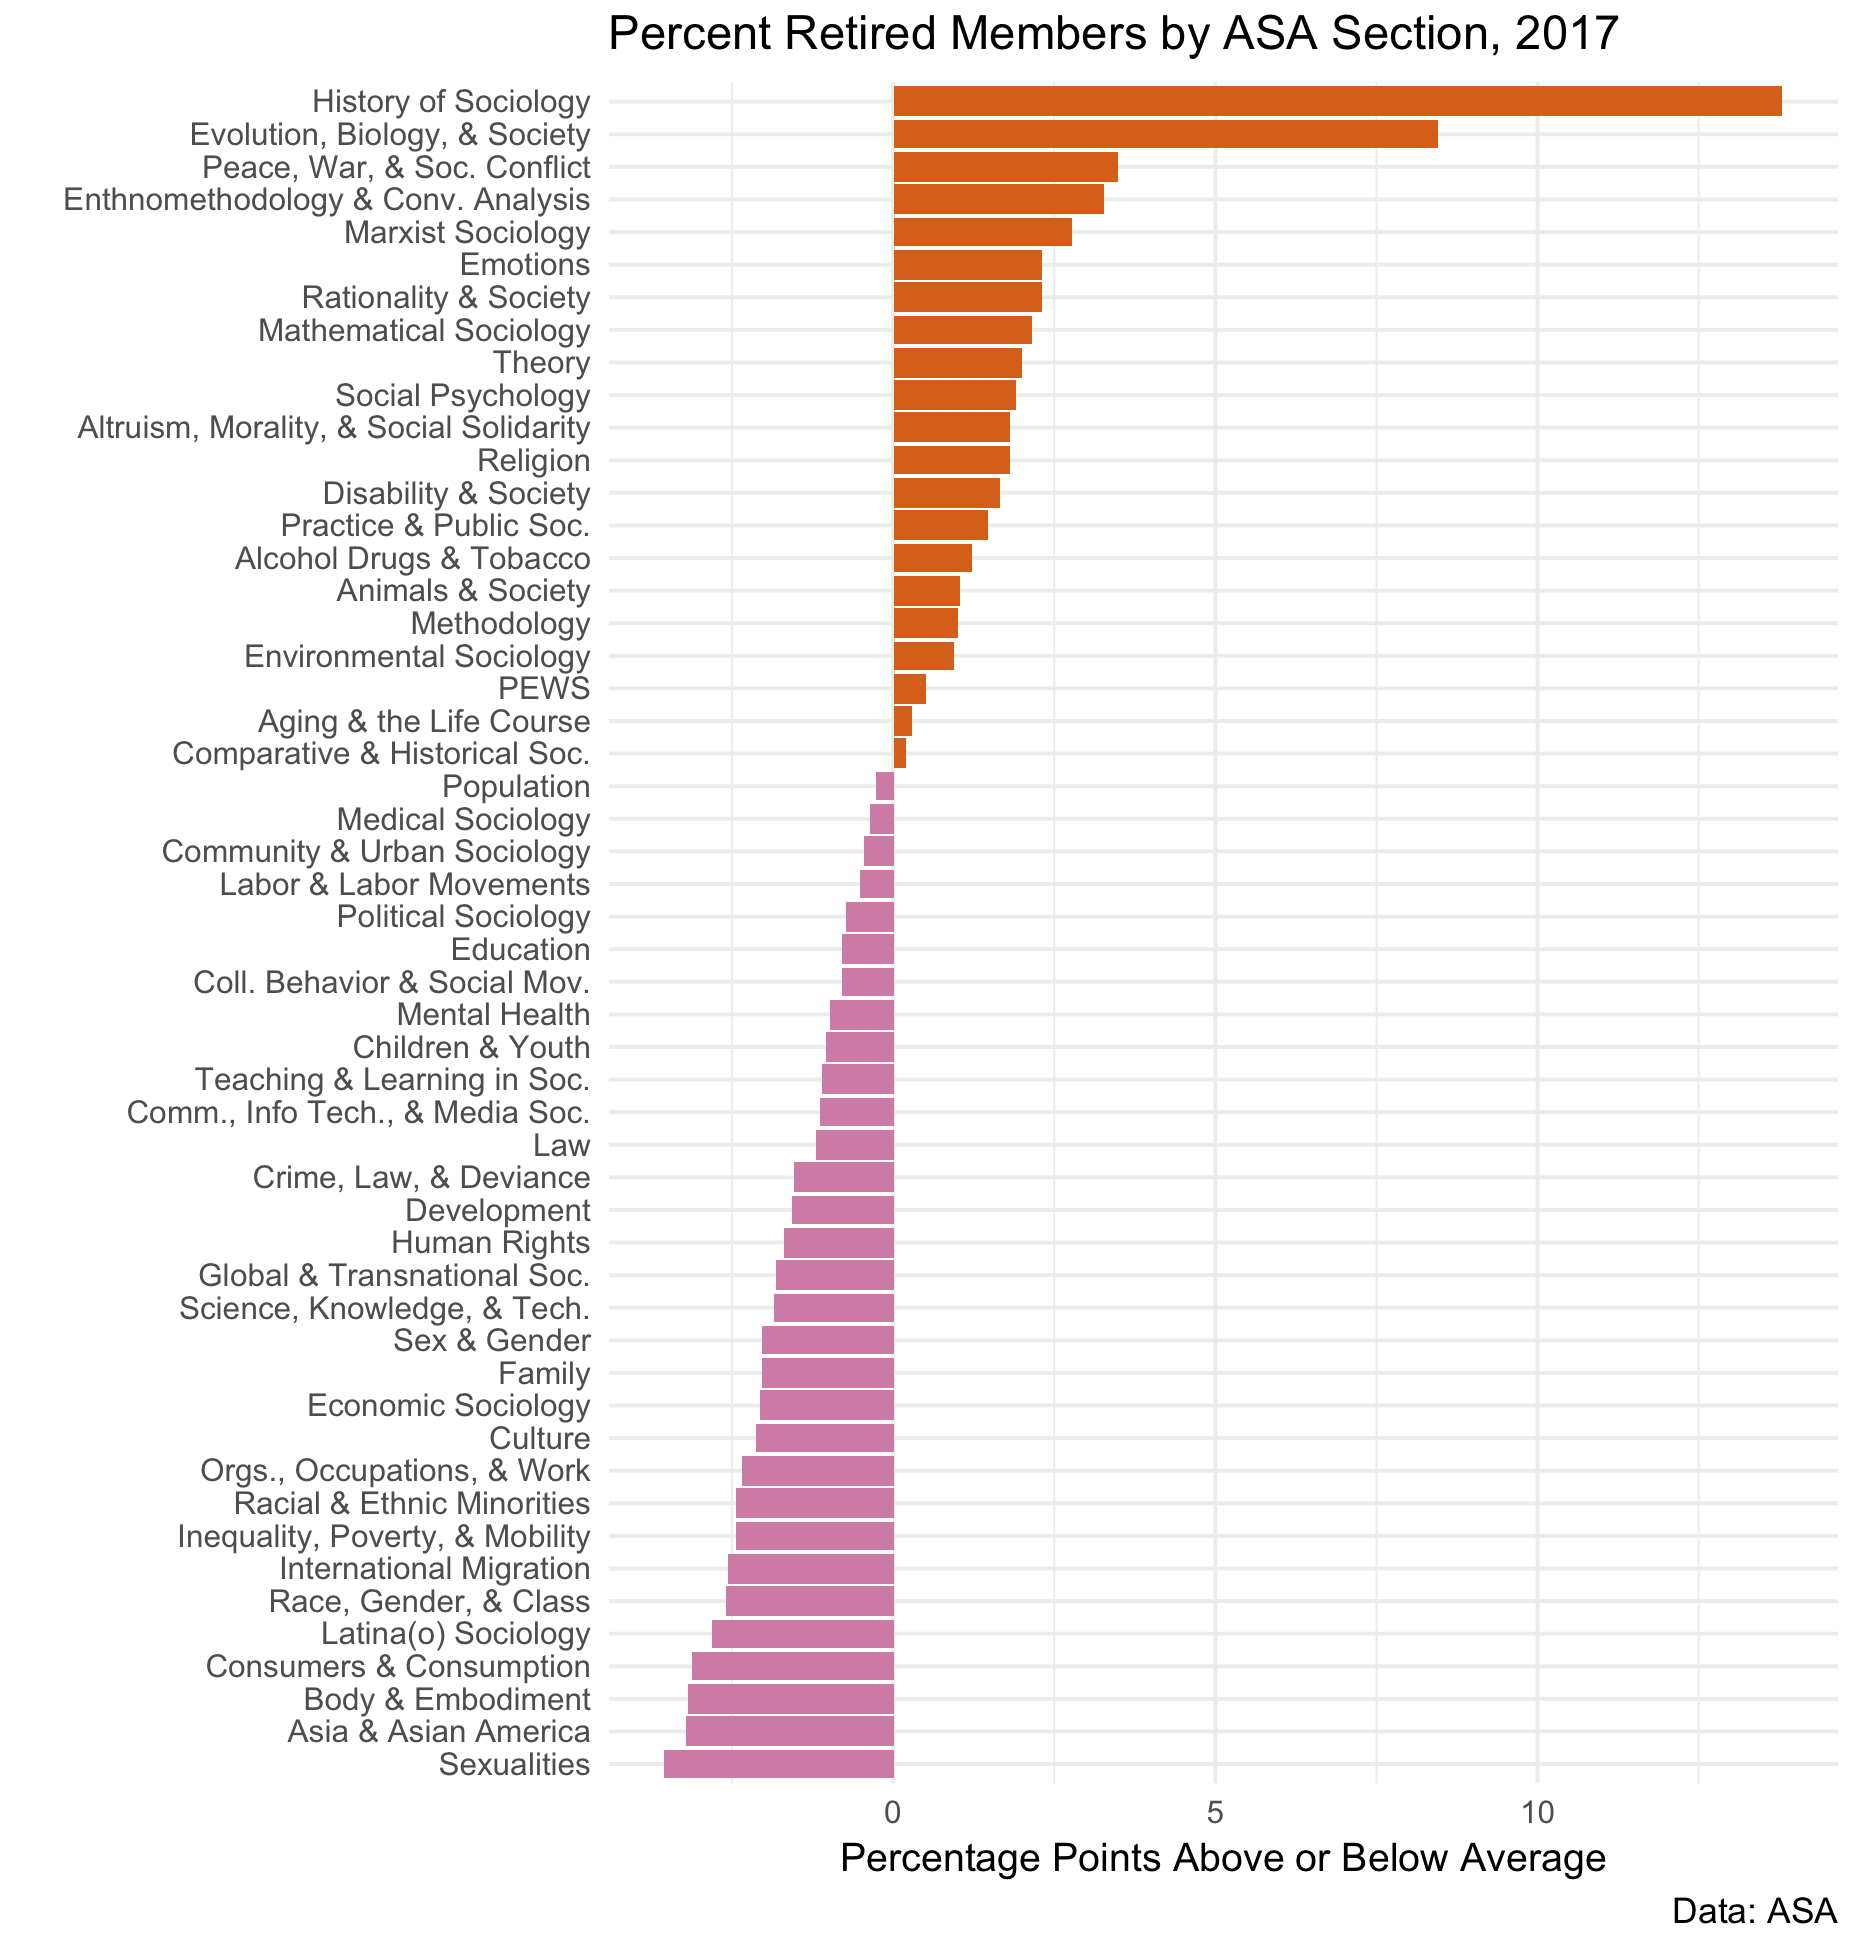
Concentrations of Retired Members.
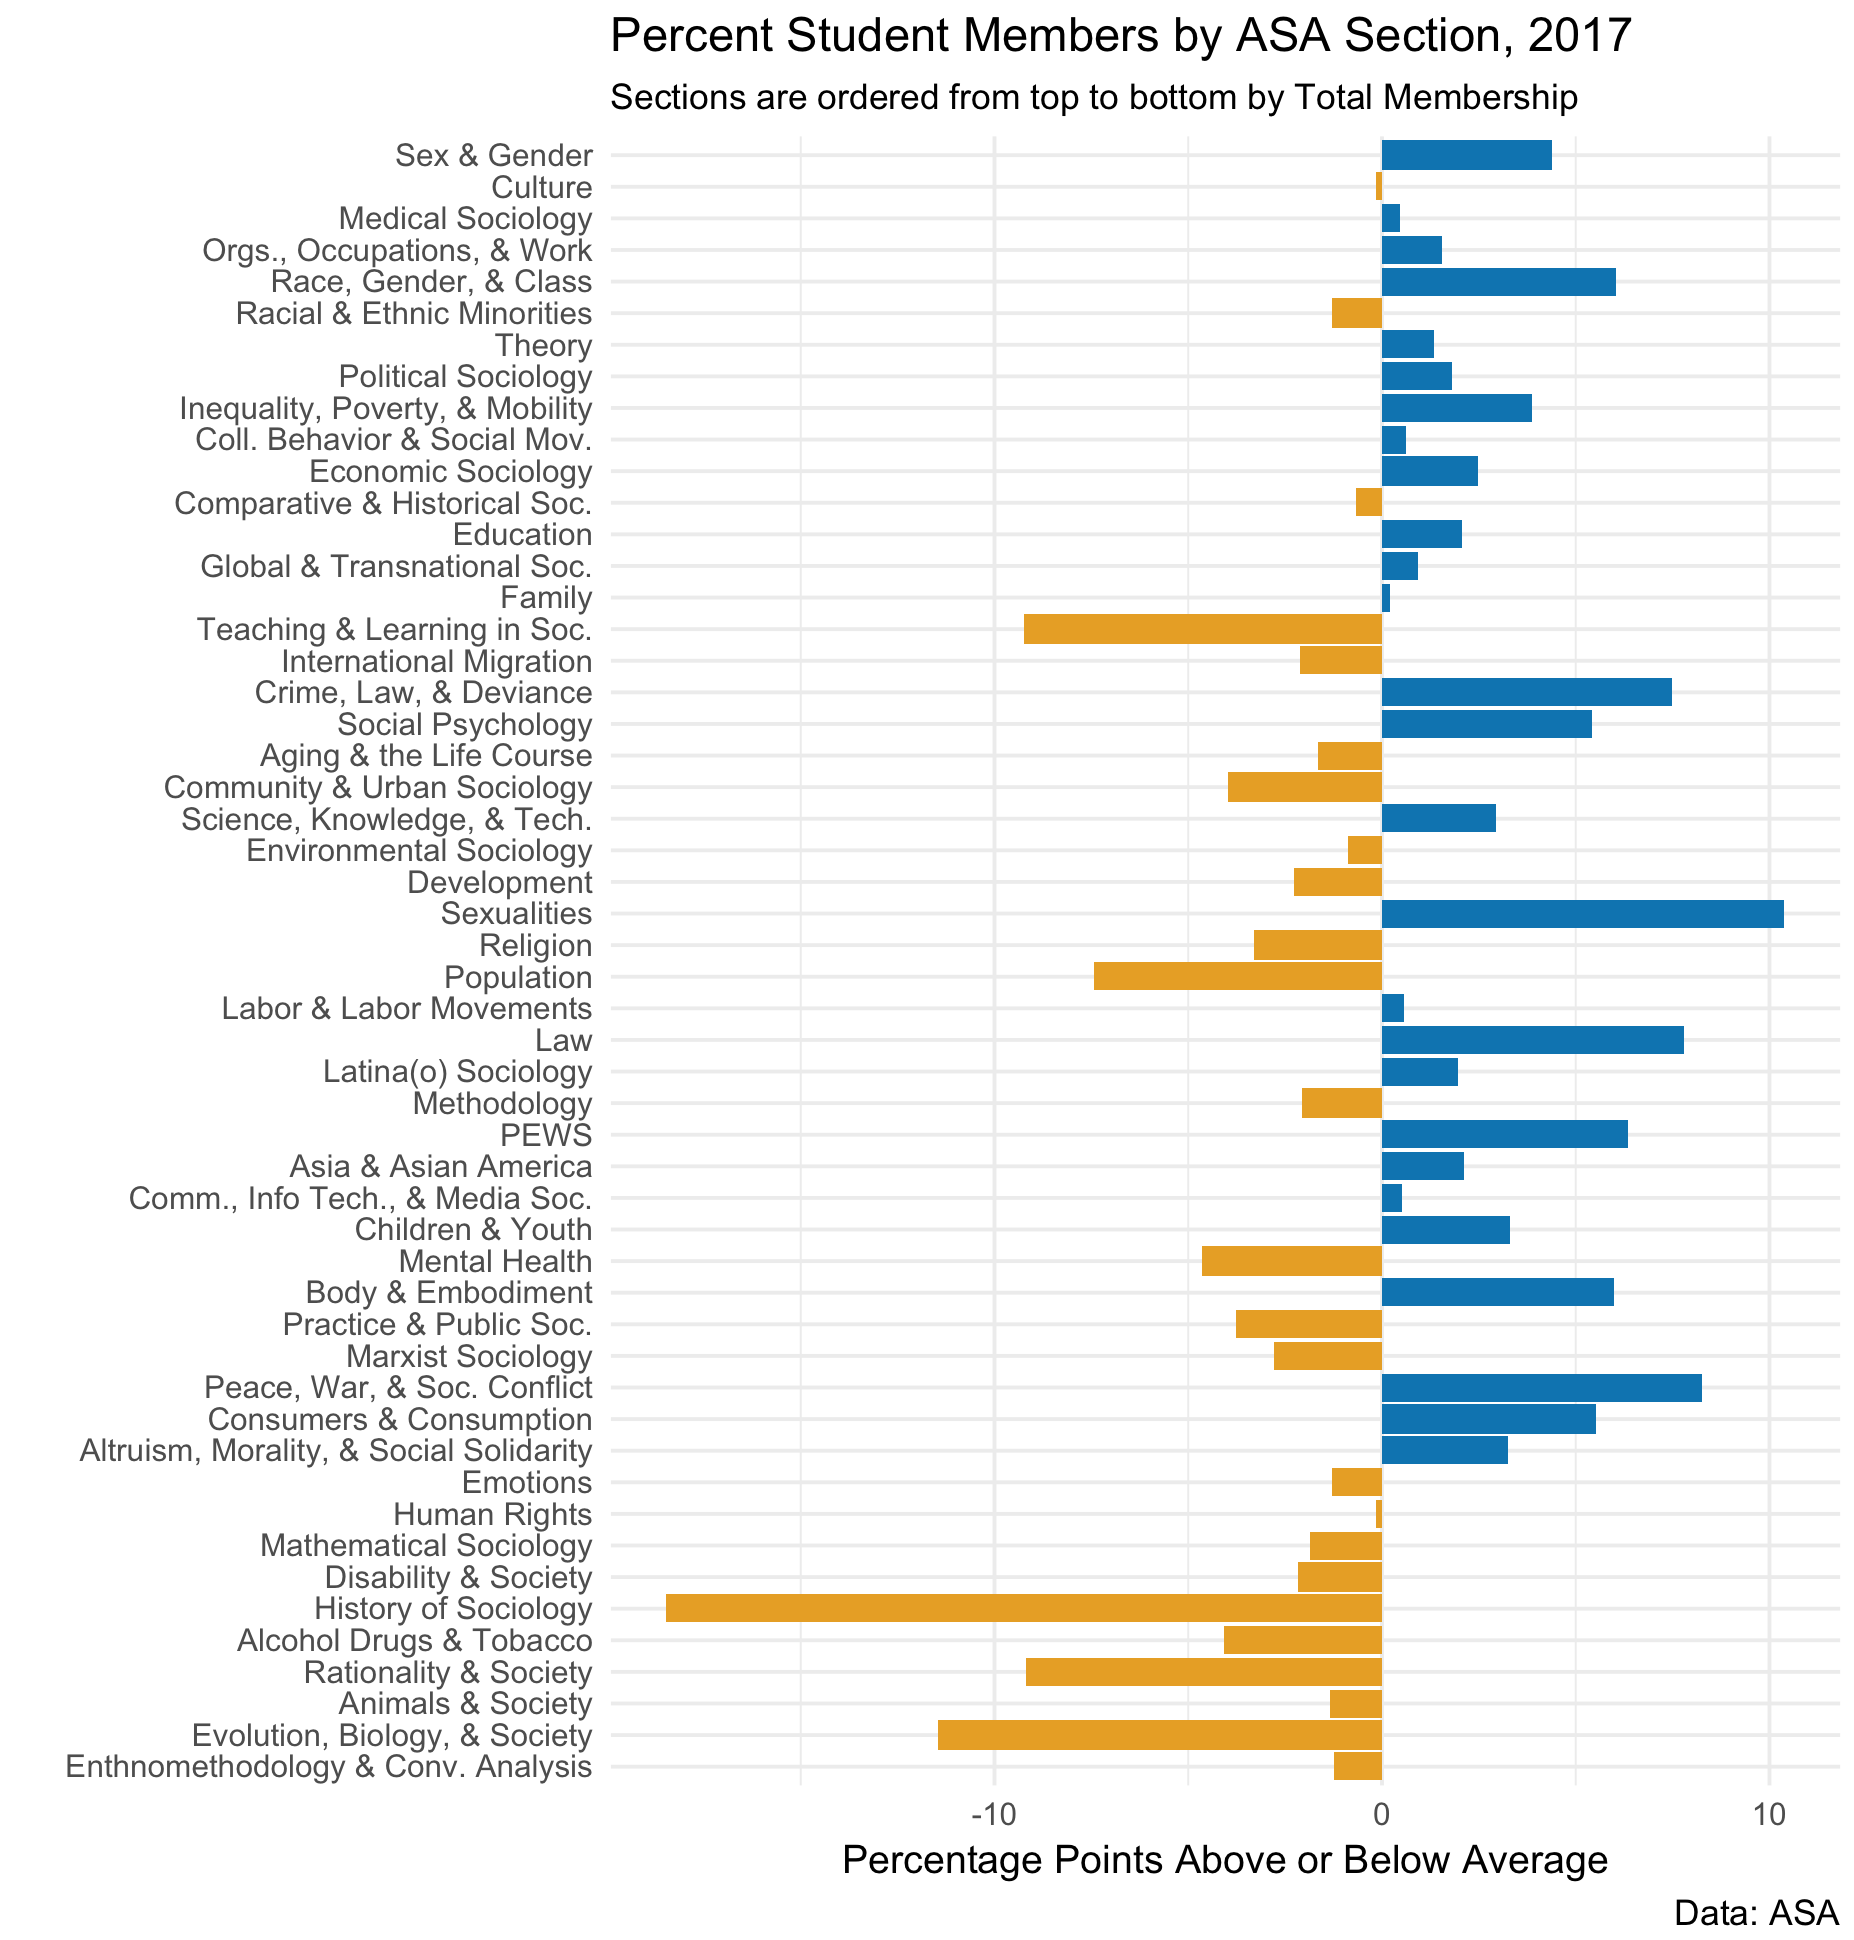
Student concentrations with sections ordered from high to low membership.
Next, some data on gender.
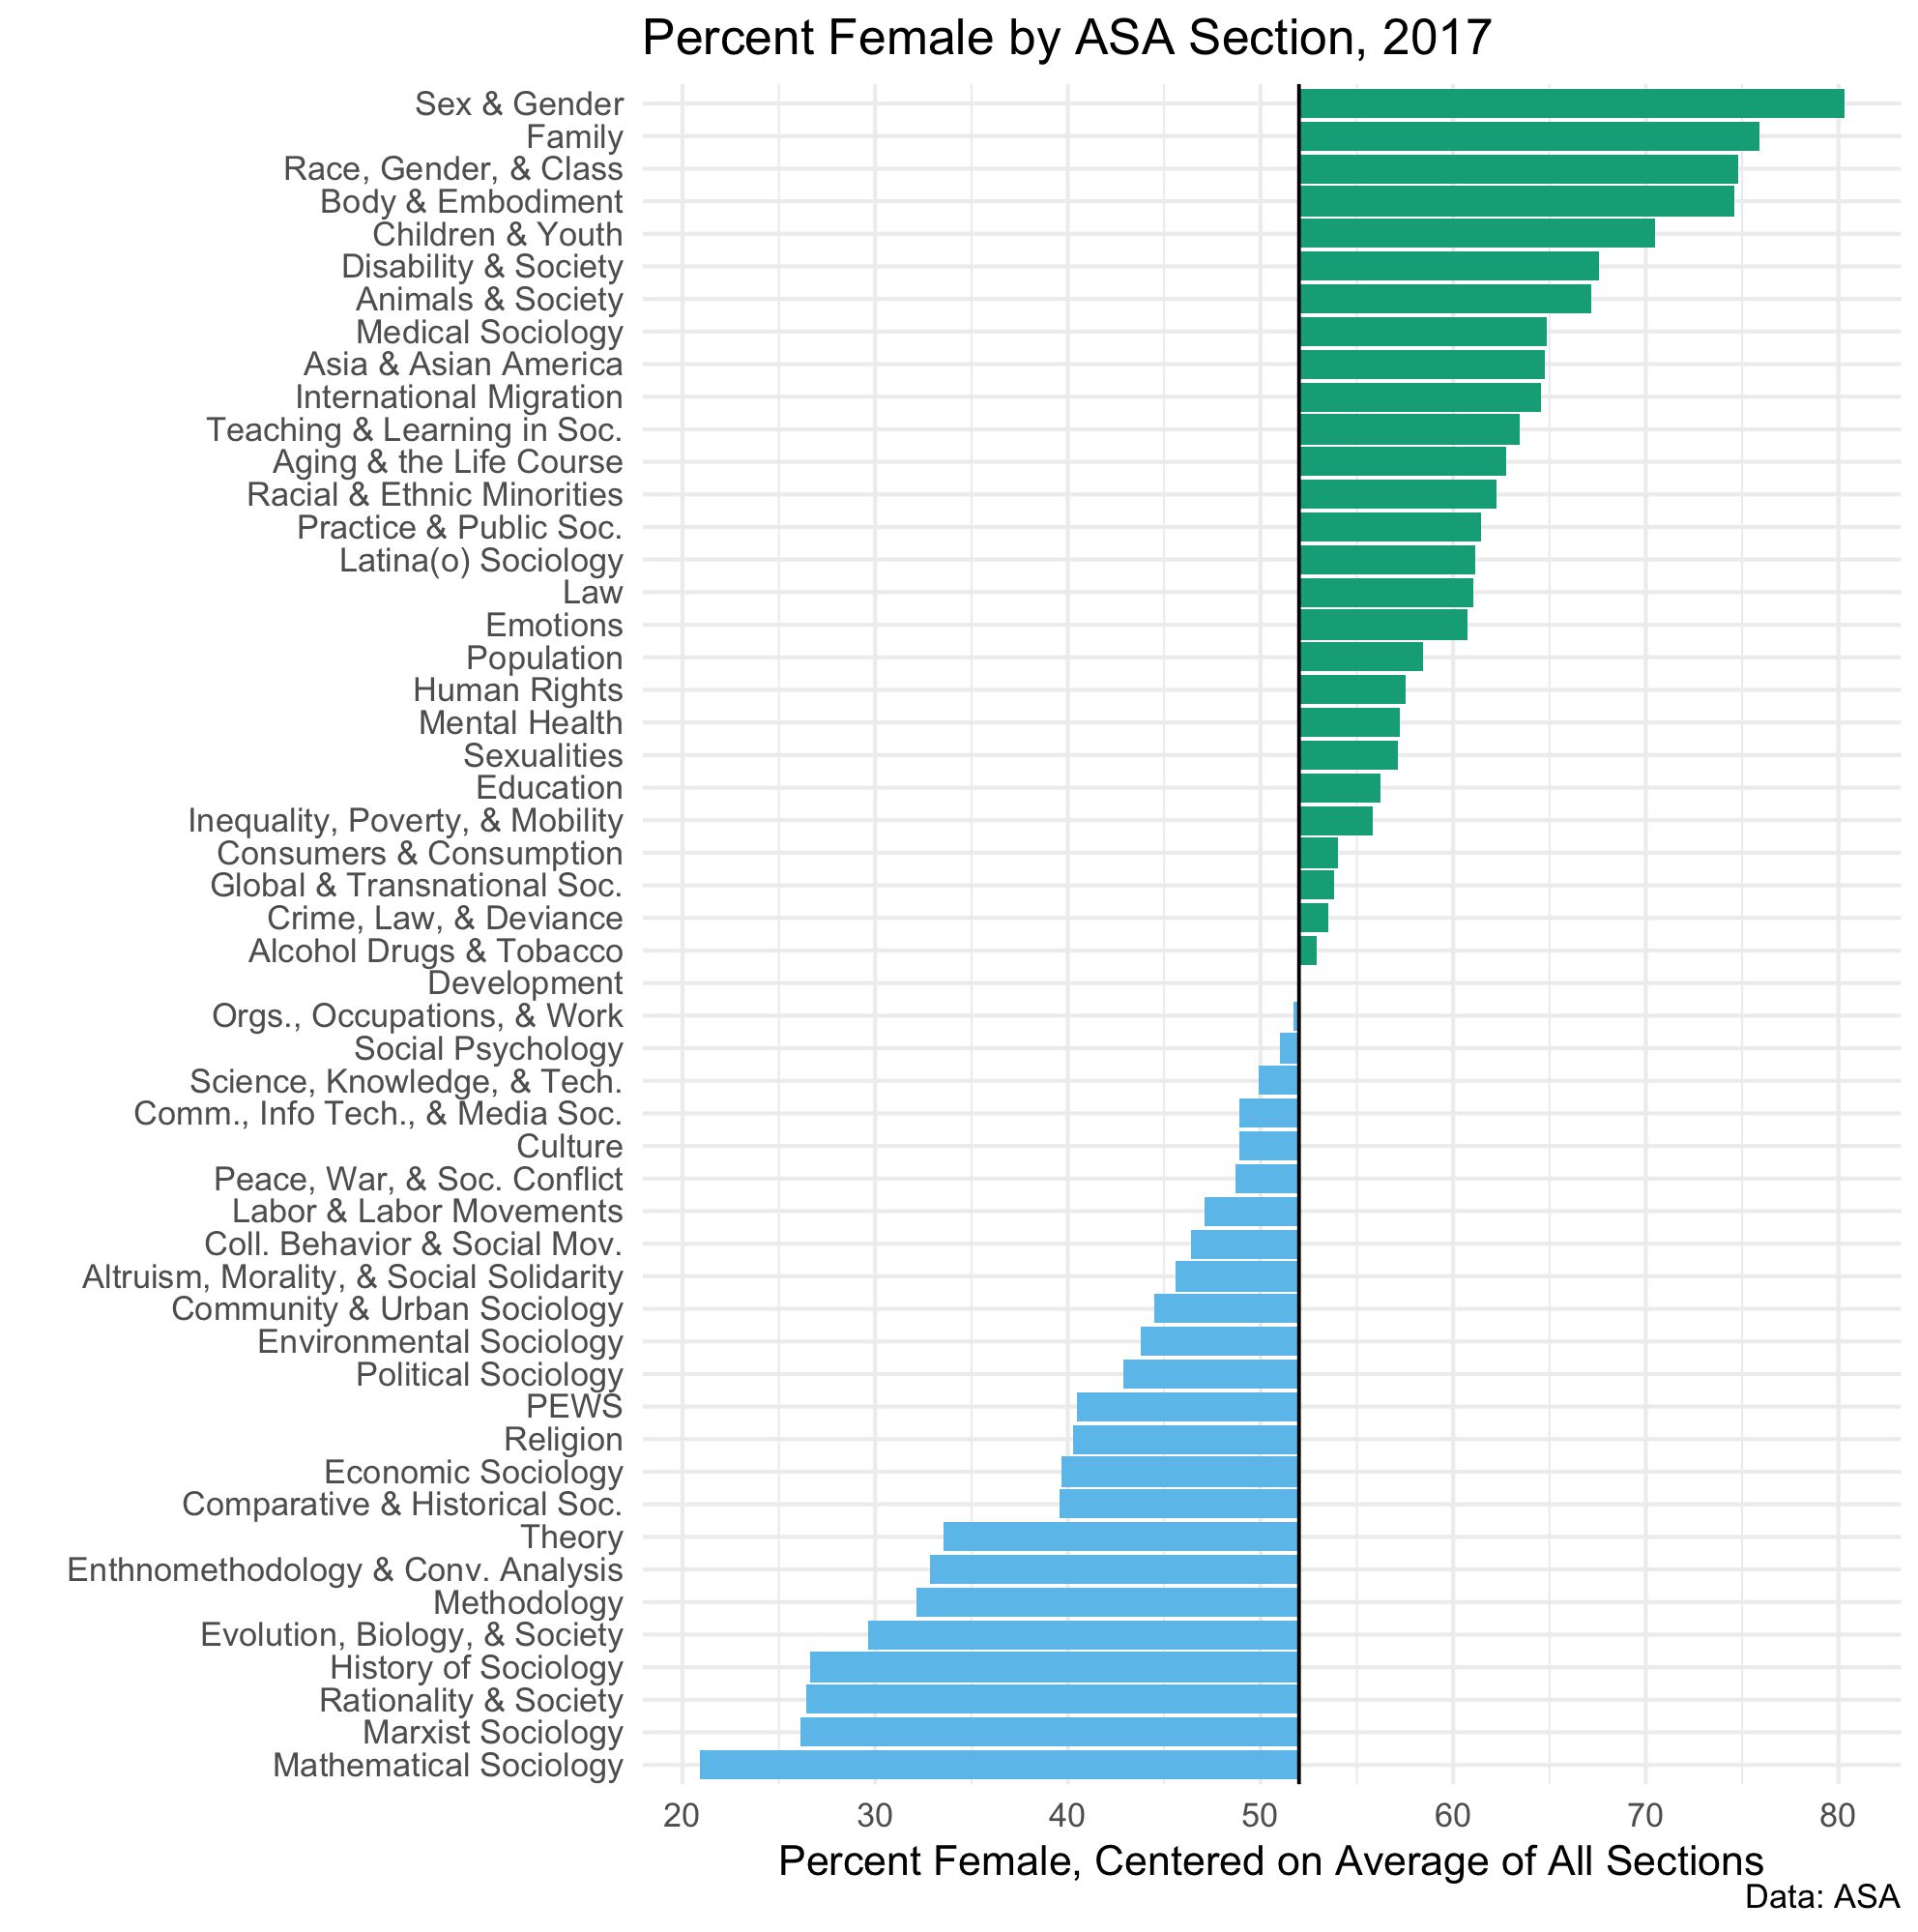
Percent women in each section, centered on average percent across all sections. The overall average is about 52 percent.
The gender composition of sections is somewhat related to how large they are.

Percent female vs total section membership.
Code and data to reproduce these figures is available on GitHub.