Data Visualization Course Notes
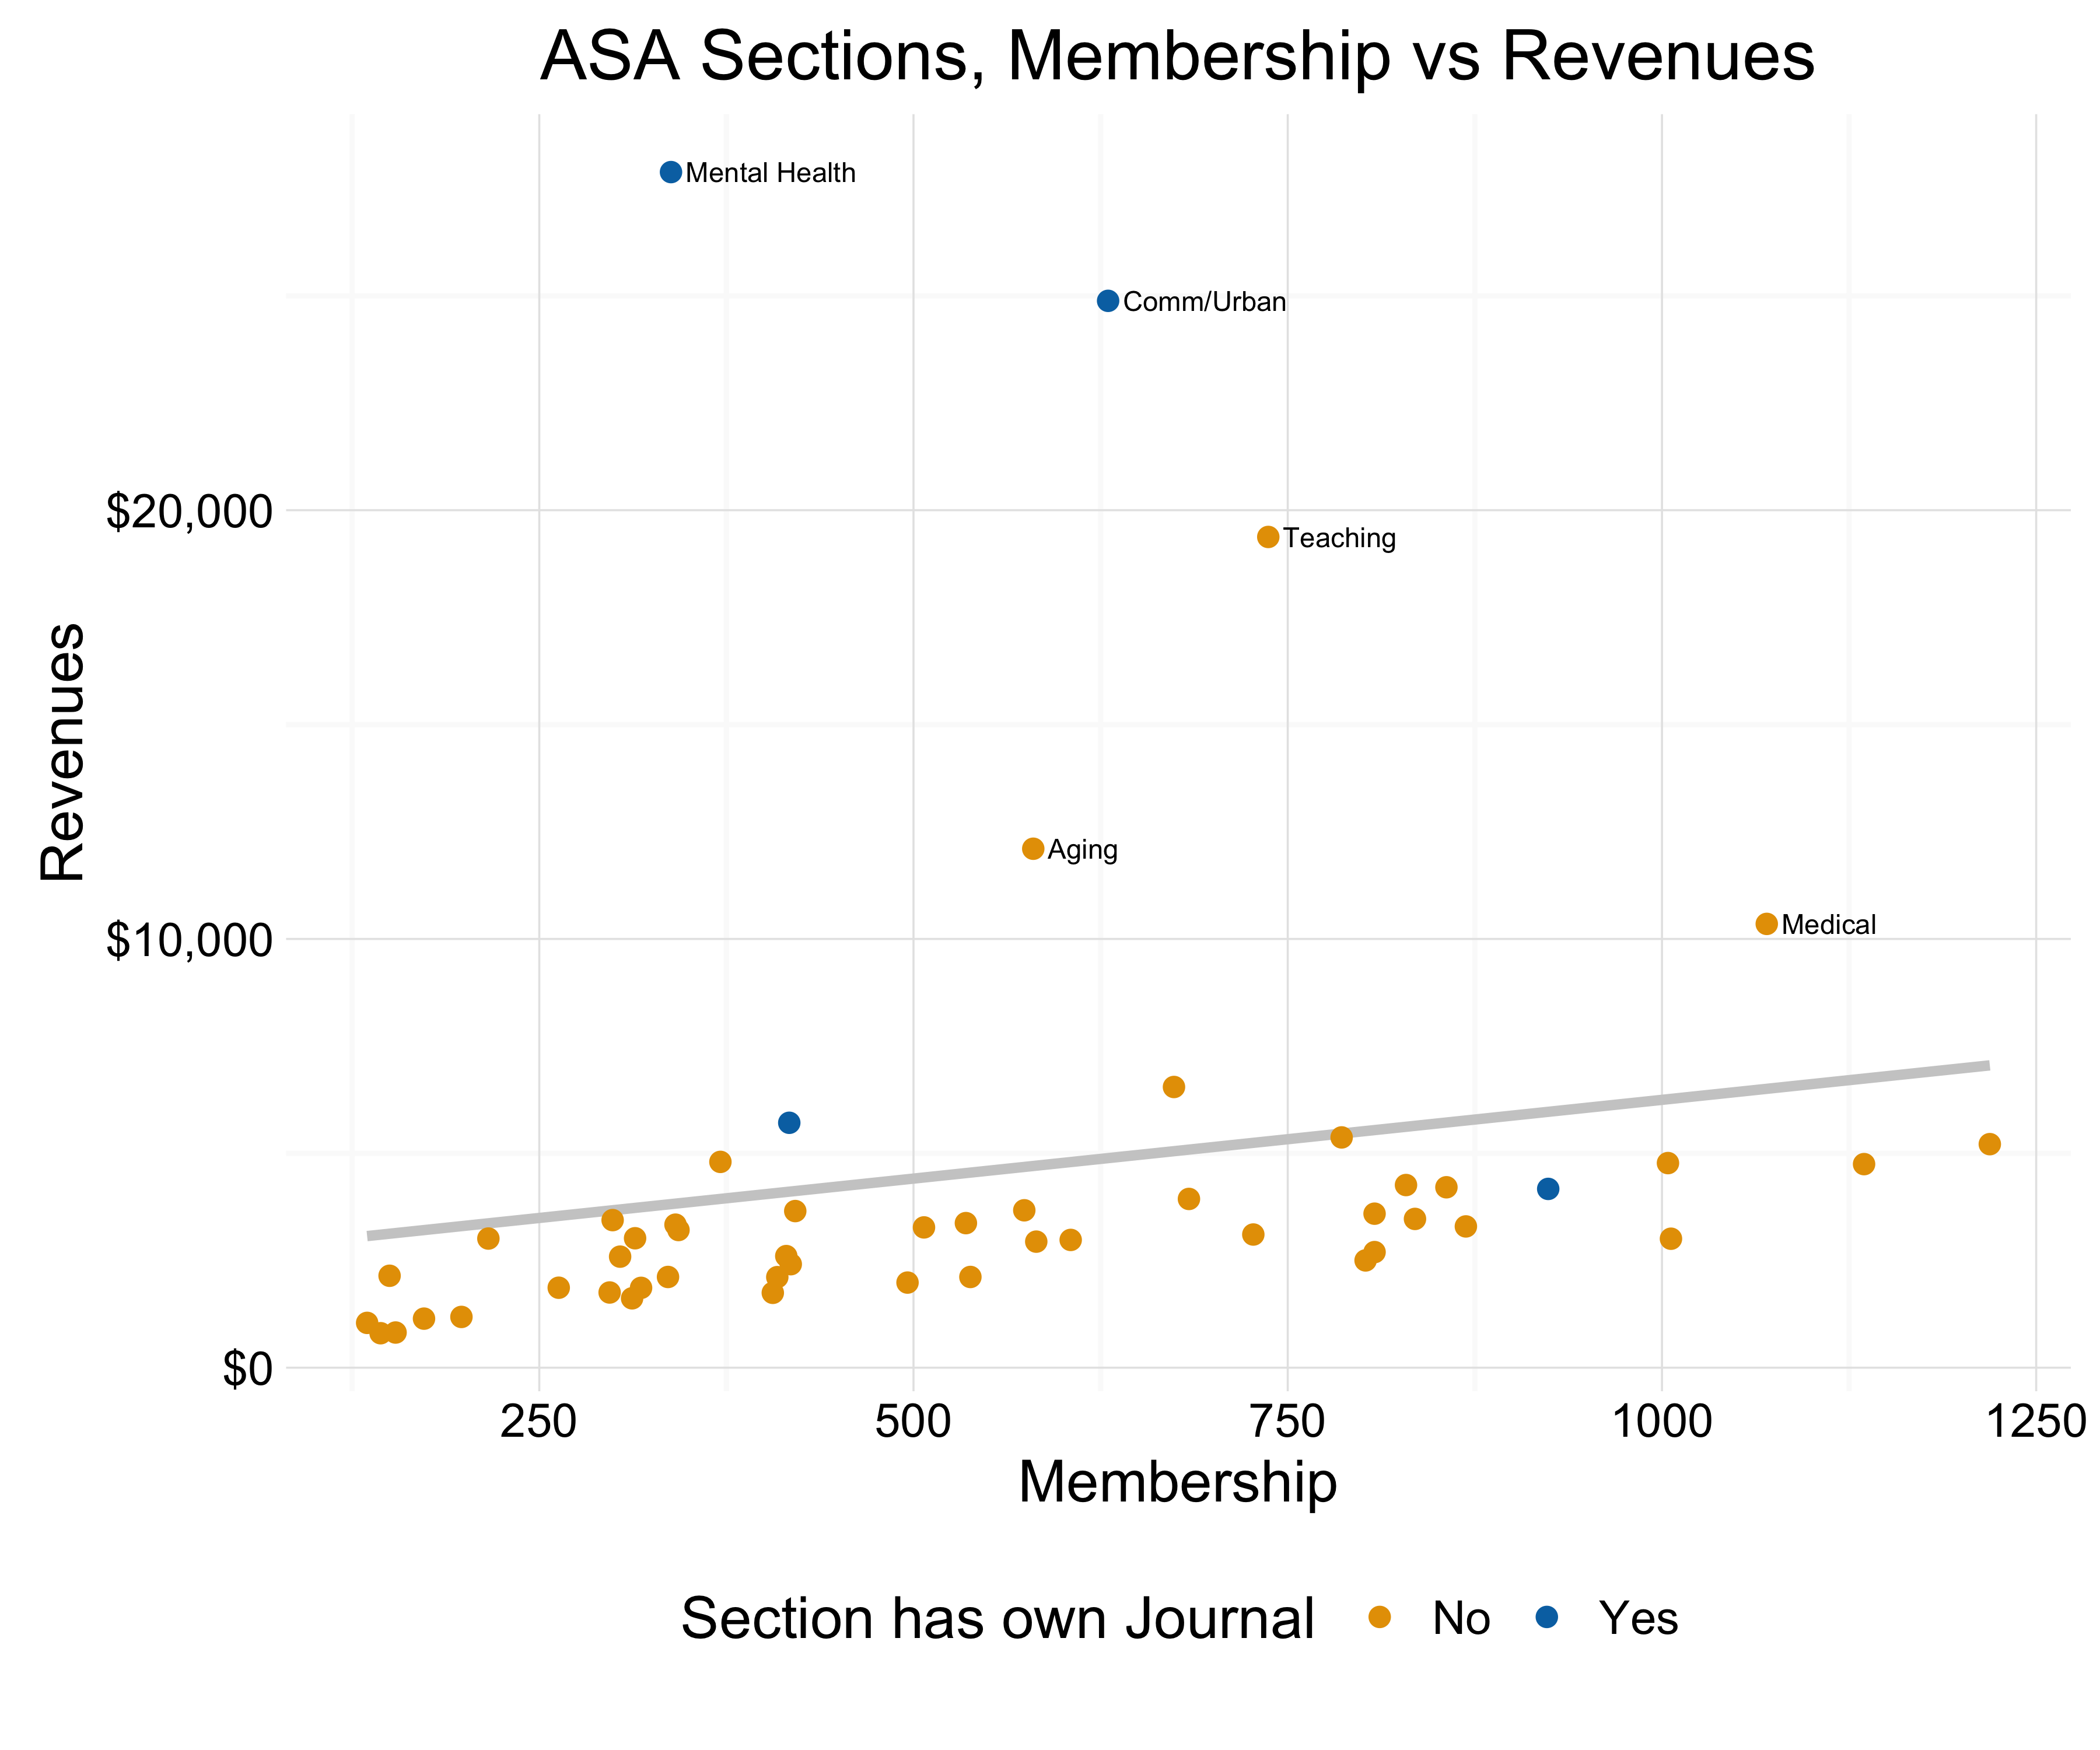
ASA Section Membership and Revenues.
I taught a half-sized introductory seminar on data visualization last semester. It’s an introduction to some principles of data visualization for working social scientists, and is focused mostly on teaching people how to use ggplot effectively. I’ve made the (slightly rough-and-ready) course notes available as a website. The notes include numerous code samples, .Rmd files for every week, and there’s a GitHub repository containing all the material to build the site, including the datasets used to make the plots. Enjoy.