Sociology Department Rankings for 2013
Last week we launched the OrgTheory/AAI 2013 Sociology Department Ranking Survey, taking advantage of Matt Salganik’s excellent All Our Ideas service to generate sociology rankings based on respondents making multiple pairwise comparisons between department. That is, questions of the form “In your judgment, which of the following is the better Sociology department?” followed by a choice between two departments. Amongst other advantages, this method tends to get you a lot of data quickly. People find it easier to make a pairwise choice between two alternatives than to assign a rating score or produce a complete ranking amongst many alternatives. They also get addicted to the process and keep making choices. In our survey, over 600 respondents made just over 46,000 pairwise comparisons. In the original version of this post I used the Session IDs supplied in the data, forgetting that the data file also provides non-identifying (hashed) IP addresses. I re-ran the analysis using voter-aggregated rather than session-aggregated data, so now there is no double-counting. The results are a little cleaner. Although the All Our Ideas site gives you the results itself, I was interested in getting some other information out of the data, particularly confidence intervals for departments. Here is a figure showing the rankings for the Top 50 departments, based on ability scores derived from a direct-comparison Bradley-Terry model.
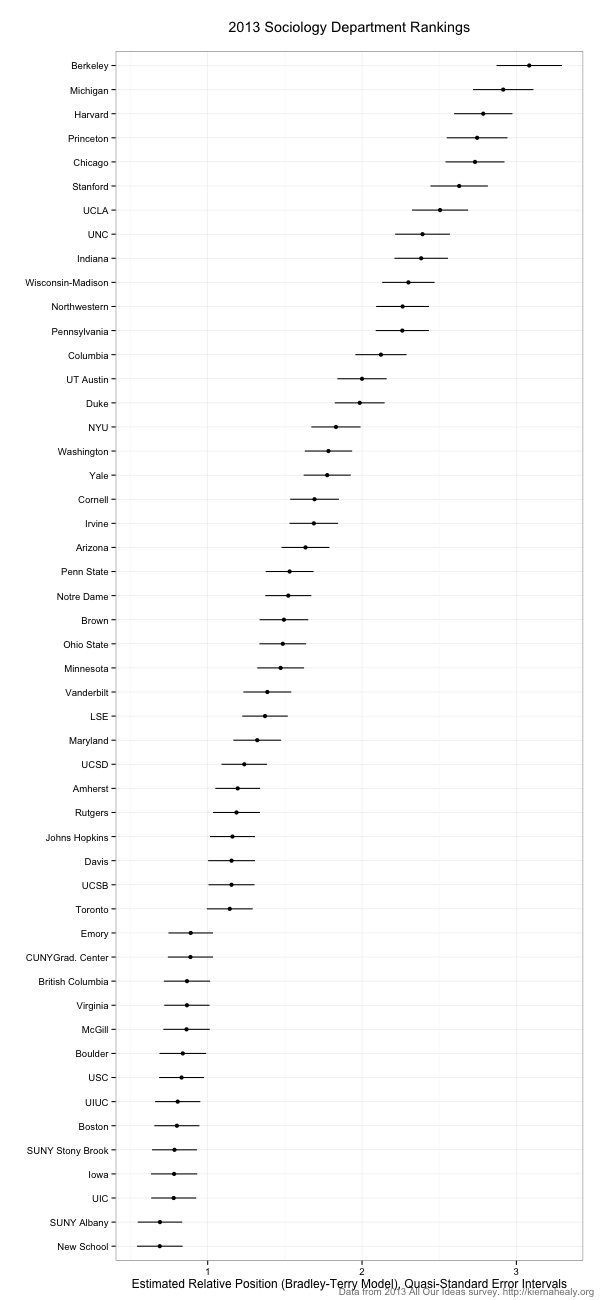
The model doesn’t take account of any rater effects, but given the general state of the U.S. News ranking methodology I am not really bothered. As you can see, the gradation looks pretty smooth. The first real “hinge” in the rankings (in the sense of a pretty clean separation between a department and the one above it) comes between Toronto and Emory. You could make a case, if you squint a bit, that UT Austin and Duke are at a similar hinge-point with respect to the departments ranked above and below them. Indiana’s high ranking is due solely to Fabio mobilizing a team of role-playing enthusiasts to relentlessly vote in the survey. (This is speculation on my part.)
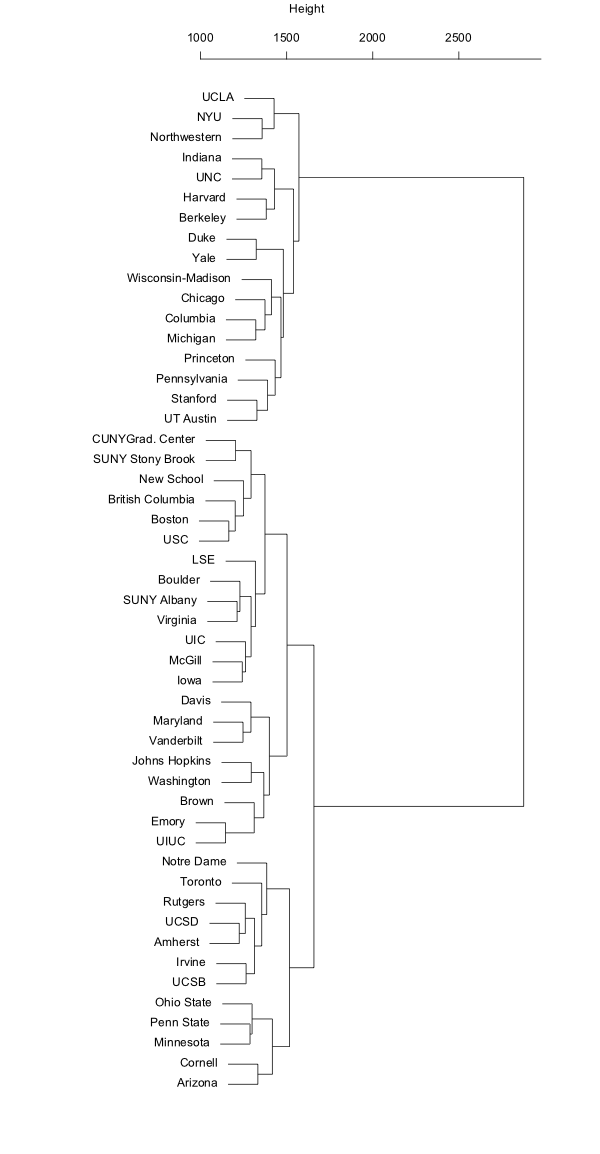
You can do other things with this data, too. Here are the results of a cluster analysis of the votes, which brings out some interesting similarities.
Finally, Baptiste Coulmont carried out his own pairwise-comparison survey of French sociology departments—at least until he was overwhelmed by the pressure exerted by people who thought the very idea of such a ranking was morally offensive—and presented a nice analysis of it on his blog. Inspired by that, here’s are the results of a principal components analysis of the voting patterns.
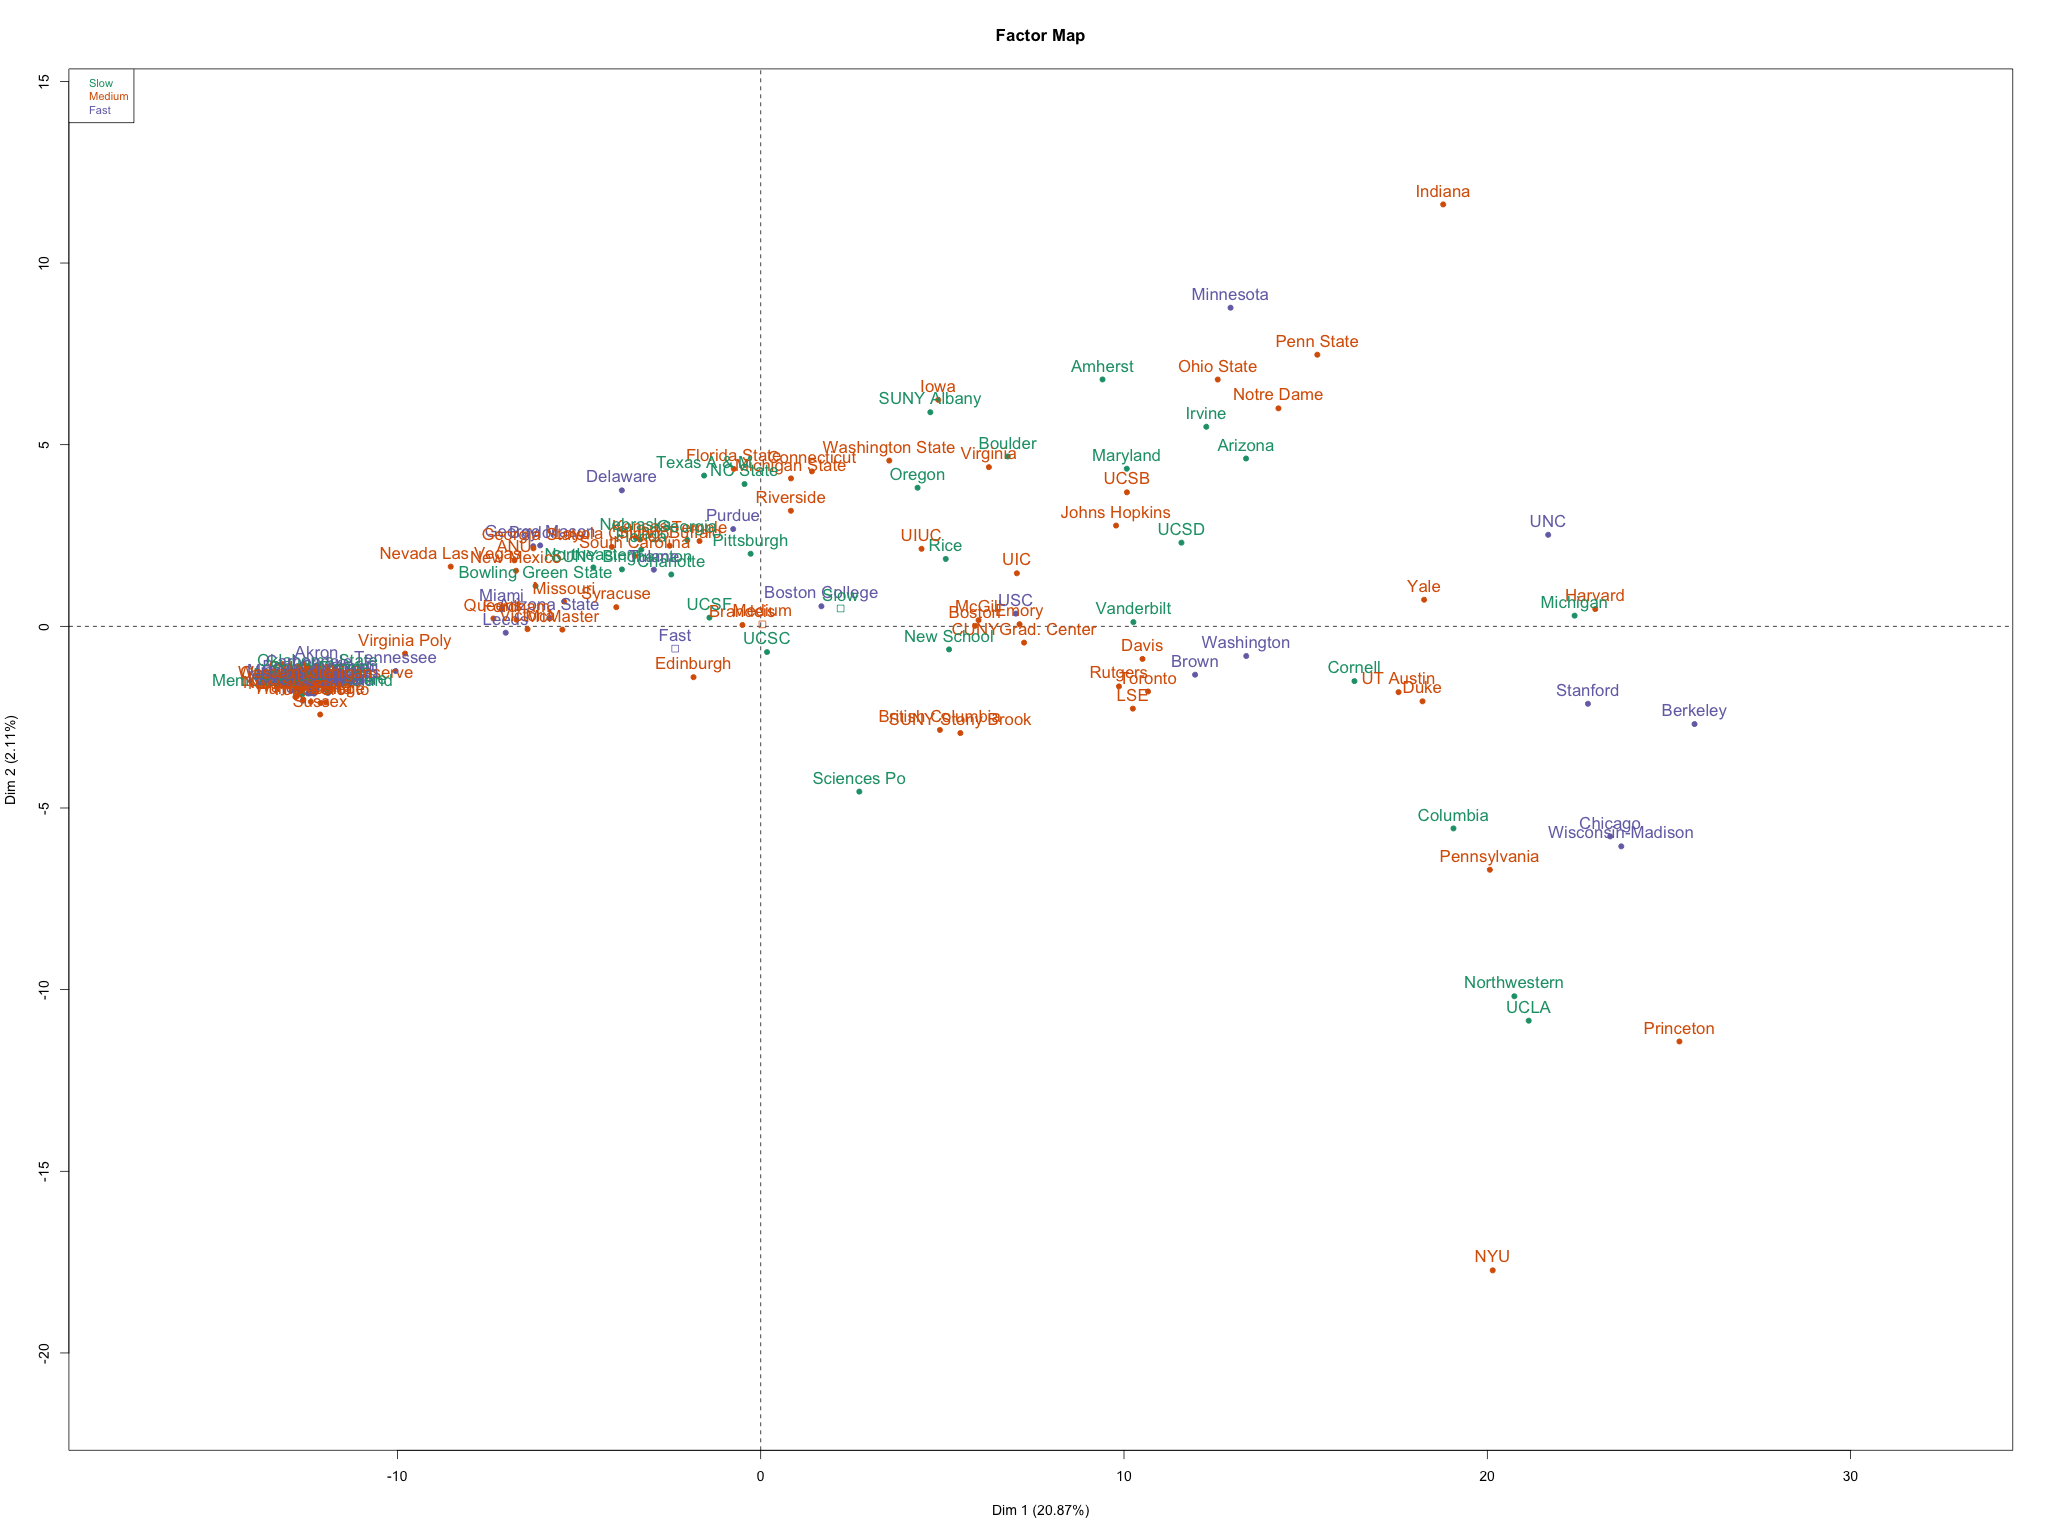
The x-axis is more or less the overall ranking itself. The y-axis is harder to interpret. The colors in the plot show how long people typically to vote for that department in comparisons, with Slow and Fast categories representing roughly the bottom and top quintles of the distribution of times. High-ranking but “Slow” departments are interesting here, as it suggests they might be difficult to place with respect to their peers.