Kieran Healy, Data Visualization. Princeton University Press.
Buy on AmazonOr buy from Powell's | from Princeton University Press
Korean Edition (Acorn publishing)
Japanese Edition (Kodansha)
Data Visualization: A Practical Introduction teaches you how to make compelling data visualizations with R and ggplot2 in a clear, sensible, and reproducible way.
Endorsements
“Finally! A data visualization guide that is simultaneously practical and elegant. Healy combines the beauty and insight of Tufte with the concrete helpfulness of Stack Exchange. Data Visualization is brimming with insights into how quantitative analysts can use visualization as a tool for understanding and communication. A must-read for anyone who works with data.” — Elizabeth Bruch, University of Michigan
“Healy’s fun and readable book is unusual in covering the ‘why do’ as well as the ‘how to’ of data visualization, demonstrating how dataviz is a key step in all stages of social science—from theory construction to measurement to modeling and interpretation of analyses—and giving readers the tools to integrate visualization into their own work.” — Andrew Gelman, Columbia University
“Data Visualization is a brilliant book that not only teaches the reader how to visualize data but also carefully considers why data visualization is essential for good social science. The book is broadly relevant, beautifully rendered, and engagingly written. It is easily accessible for students at any level and will be an incredible teaching resource for courses on research methods, statistics, and data visualization. It is packed full of clear-headed and sage insights.” Becky Pettit, University of Texas at Austin
“Healy provides a unique introduction to the process of visualizing quantitative data, offering a remarkably coherent treatment that will appeal to novices and advanced analysts alike. There is no other book quite like this.” — Thomas J. Leeper, London School of Economics
“Kieran Healy has written a wonderful book that fills an important niche in an increasingly crowded landscape of materials about software in R. Data Visualization is clear, beautifully formatted, and full of careful insights.” — Brandon Stewart, Princeton University
“Healy’s prose is clear and direct. I came away from this book with a much better understanding of both visualizations and R.” — Neal Caren, University of North Carolina at Chapel Hill
“Innovative and extraordinarily well-written.” — Jeremy Freese, Stanford University
Summary
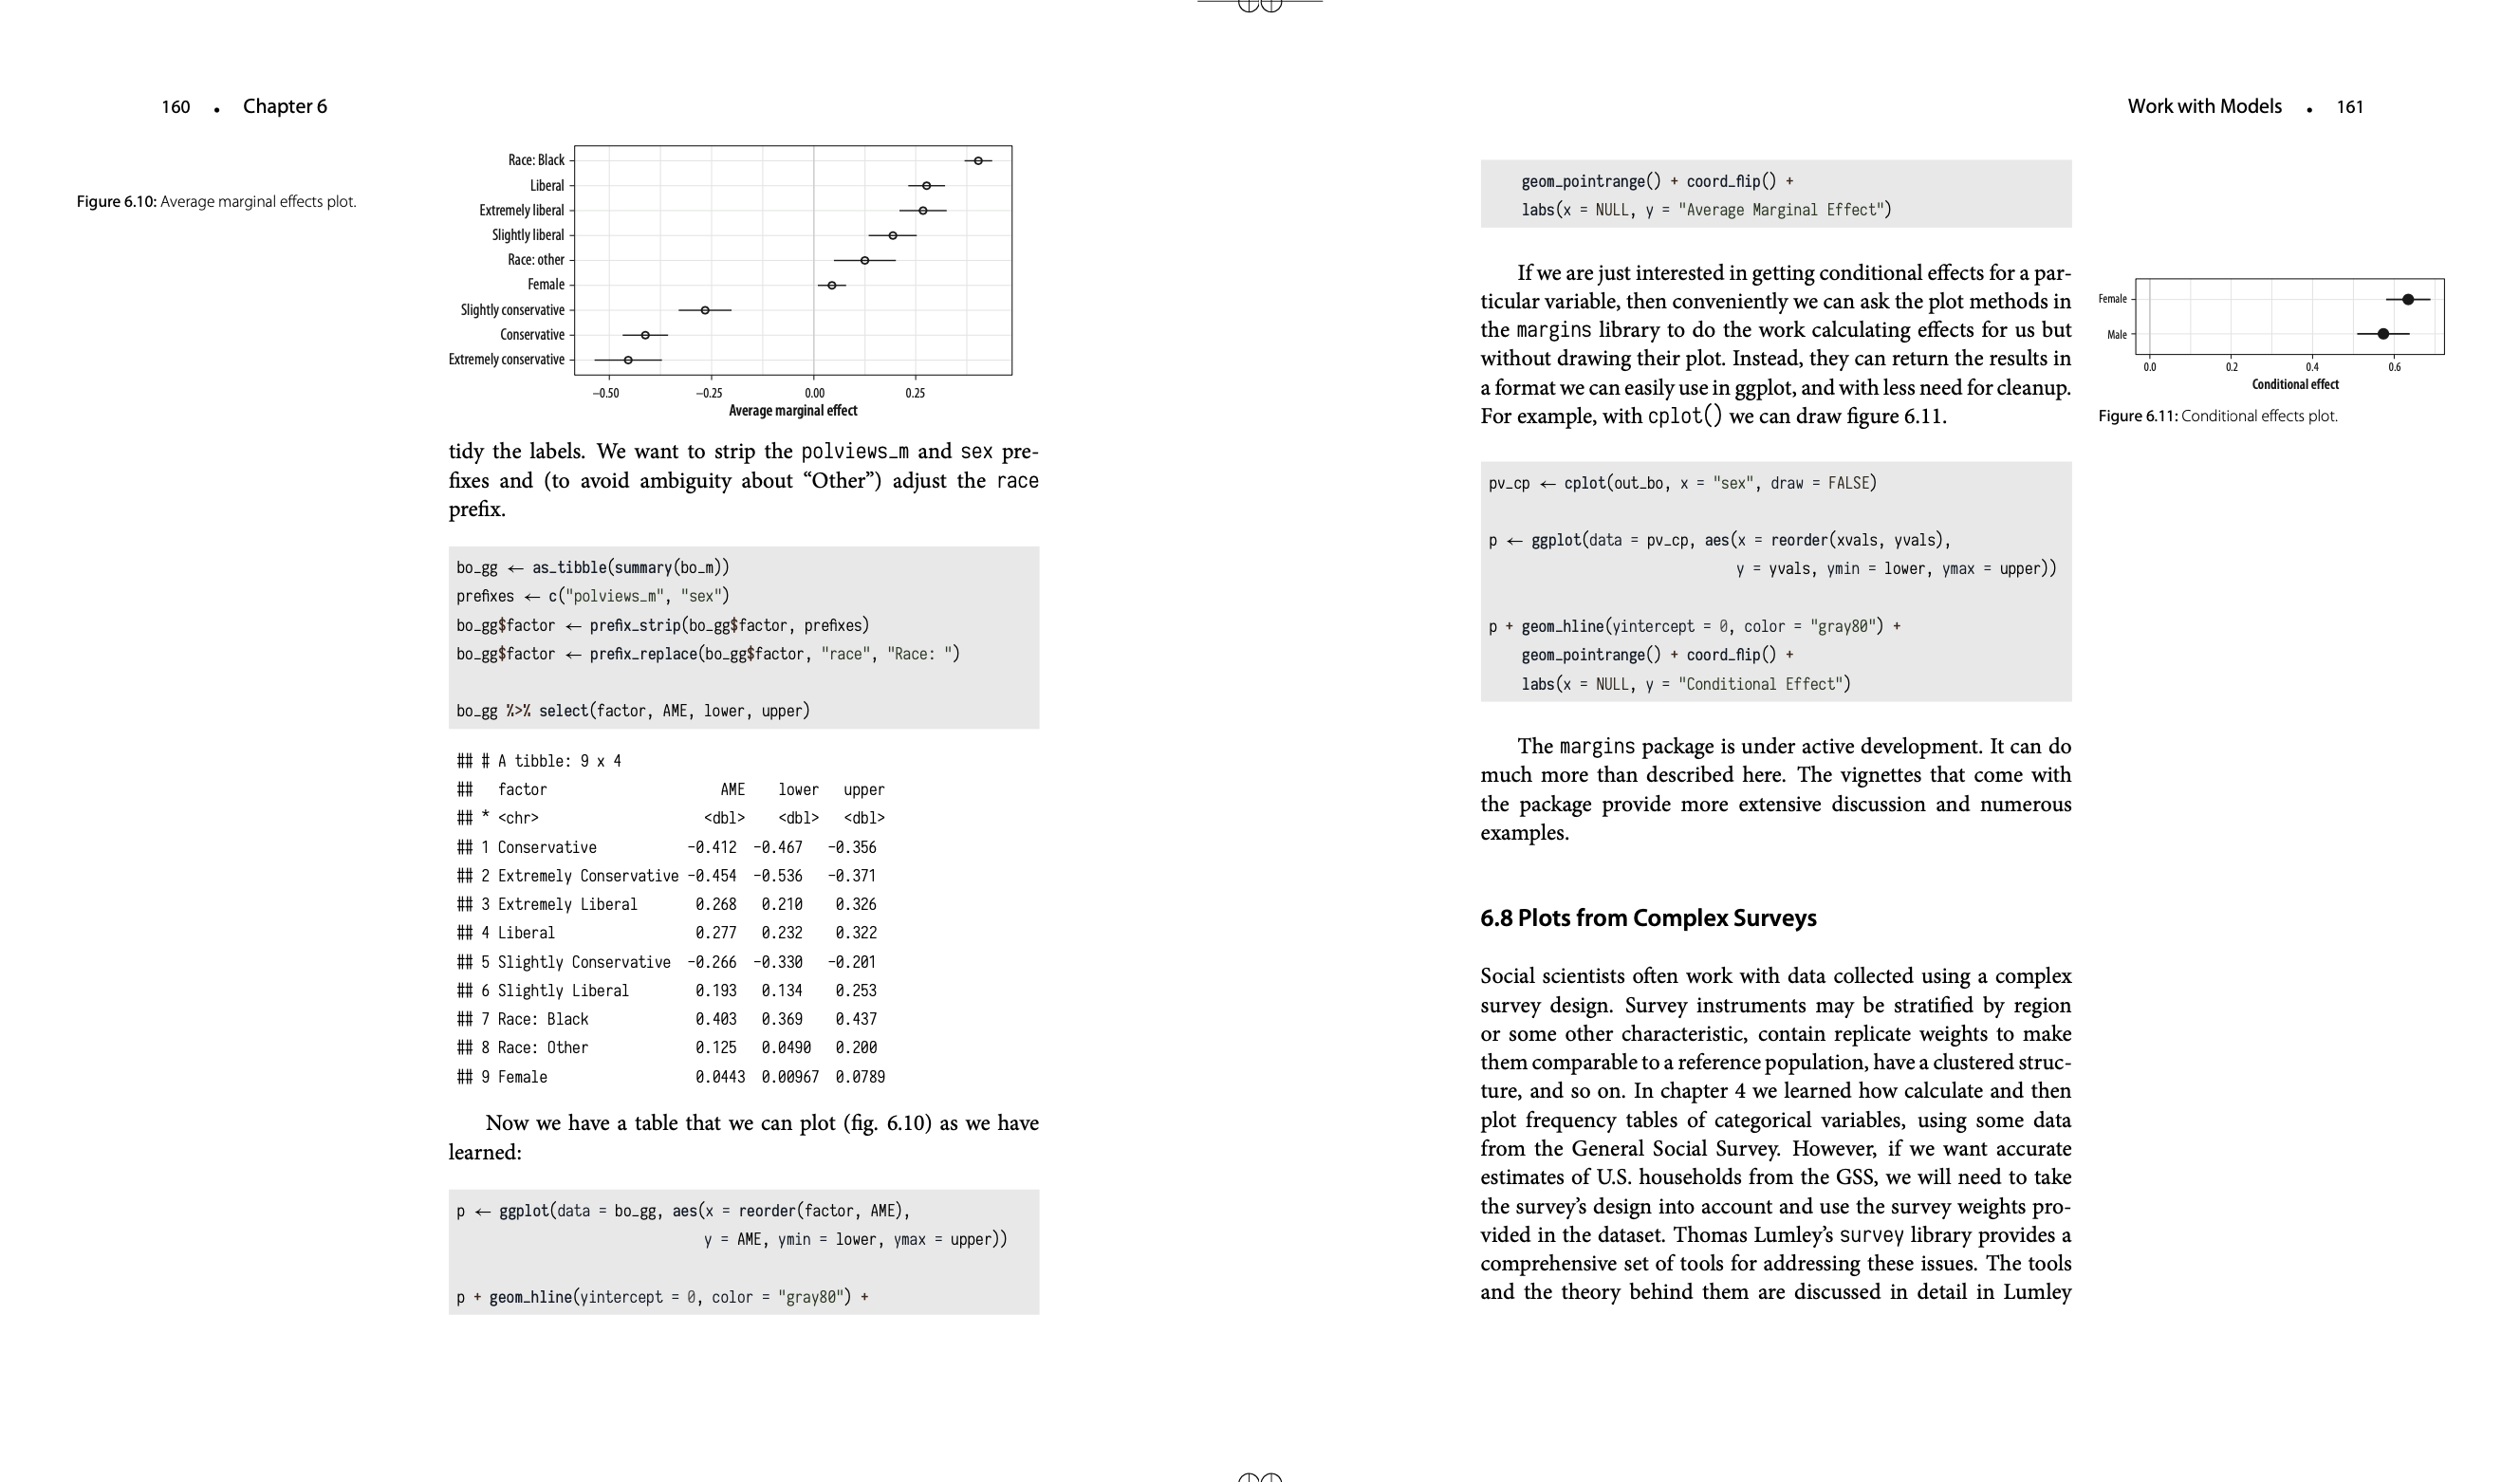
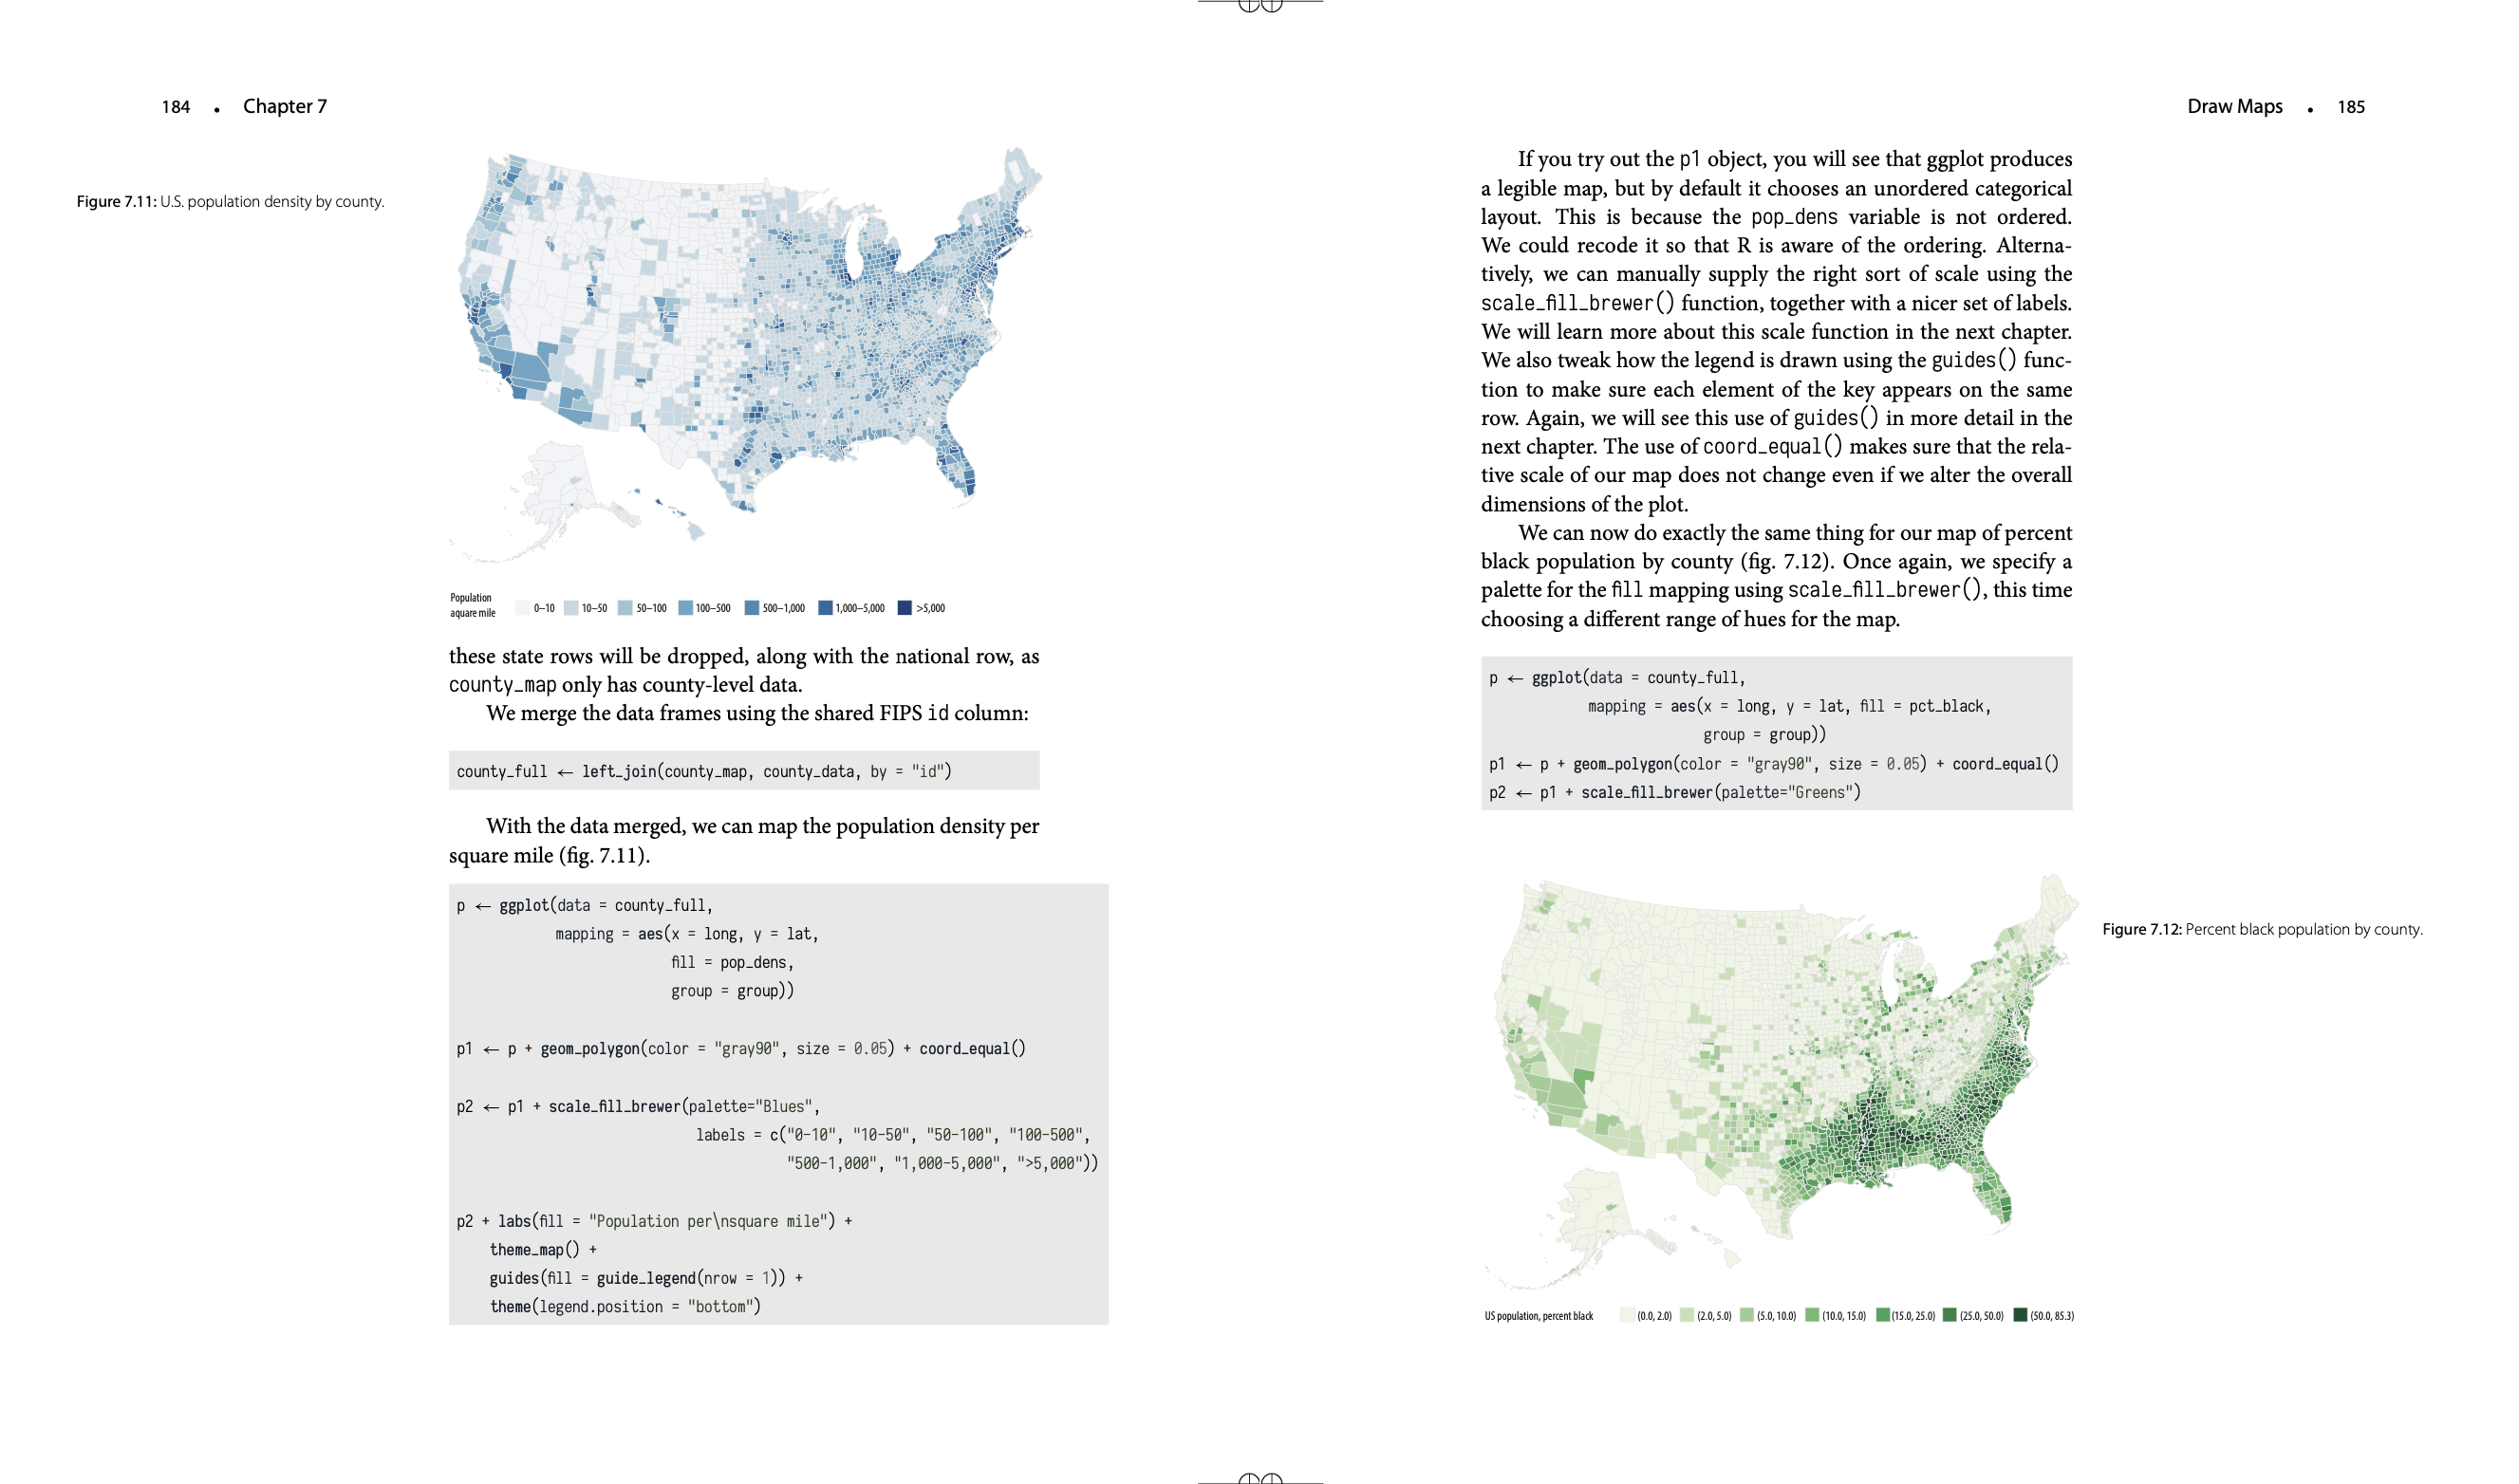
Data Visualization teaches the reader how to think about good data visualization, and how to do it. It begins with a discussion of some core ideas about how we see graphs, what makes some of them better than others, and how to begin cultivating good judgment about visualization. Then, through a series of worked examples, the book shows you how to build plots piece by piece, beginning with scatterplots and summaries of single variables, then moving on to more complex graphics. Topics covered include plotting continuous and categorical variables, layering information on graphics; faceting grouped data to produce effective “small multiple” plots; transforming data to easily produce visual summaries on the graph such as trend lines, linear fits, error ranges, and boxplots; creating maps, and also some alternatives to maps worth considering when presenting country- or state-level data. Plotting estimates from statistical models and from complex survey designs are also covered. The book then explores the process of refining plots to accomplish common tasks such as highlighting key features of the data, labeling particular items of interest, annotating plots, and changing their overall appearance. Finally, it discusses some strategies for presenting graphical results in different formats, and to different sorts of audiences.
Learning how to visualize data effectively is more than just knowing how to write code that produces figures from data. This book will teach you how to do that. But it will also teach you how to think about the information you want to show, and how to consider the audience you are showing it to—including the most common case, when the audience is yourself.
Data Visualization: A Practical Introduction is published by Princeton University Press. A draft version of the manuscript is available, as a website, at http://socviz.co.
Teaching and Learning Materials 
The socviz R package provides datasets, functions, and a course packet to use as you work through the book yourself or for use in the classroom. You can learn more about it at its website. The code for almost all the figures in the book (along with other examples and supplementary material) is included in a series of R Markdown notebooks contained in the socviz package. For details, see the package website.