Vaccination Exemptions in California Kindergartens
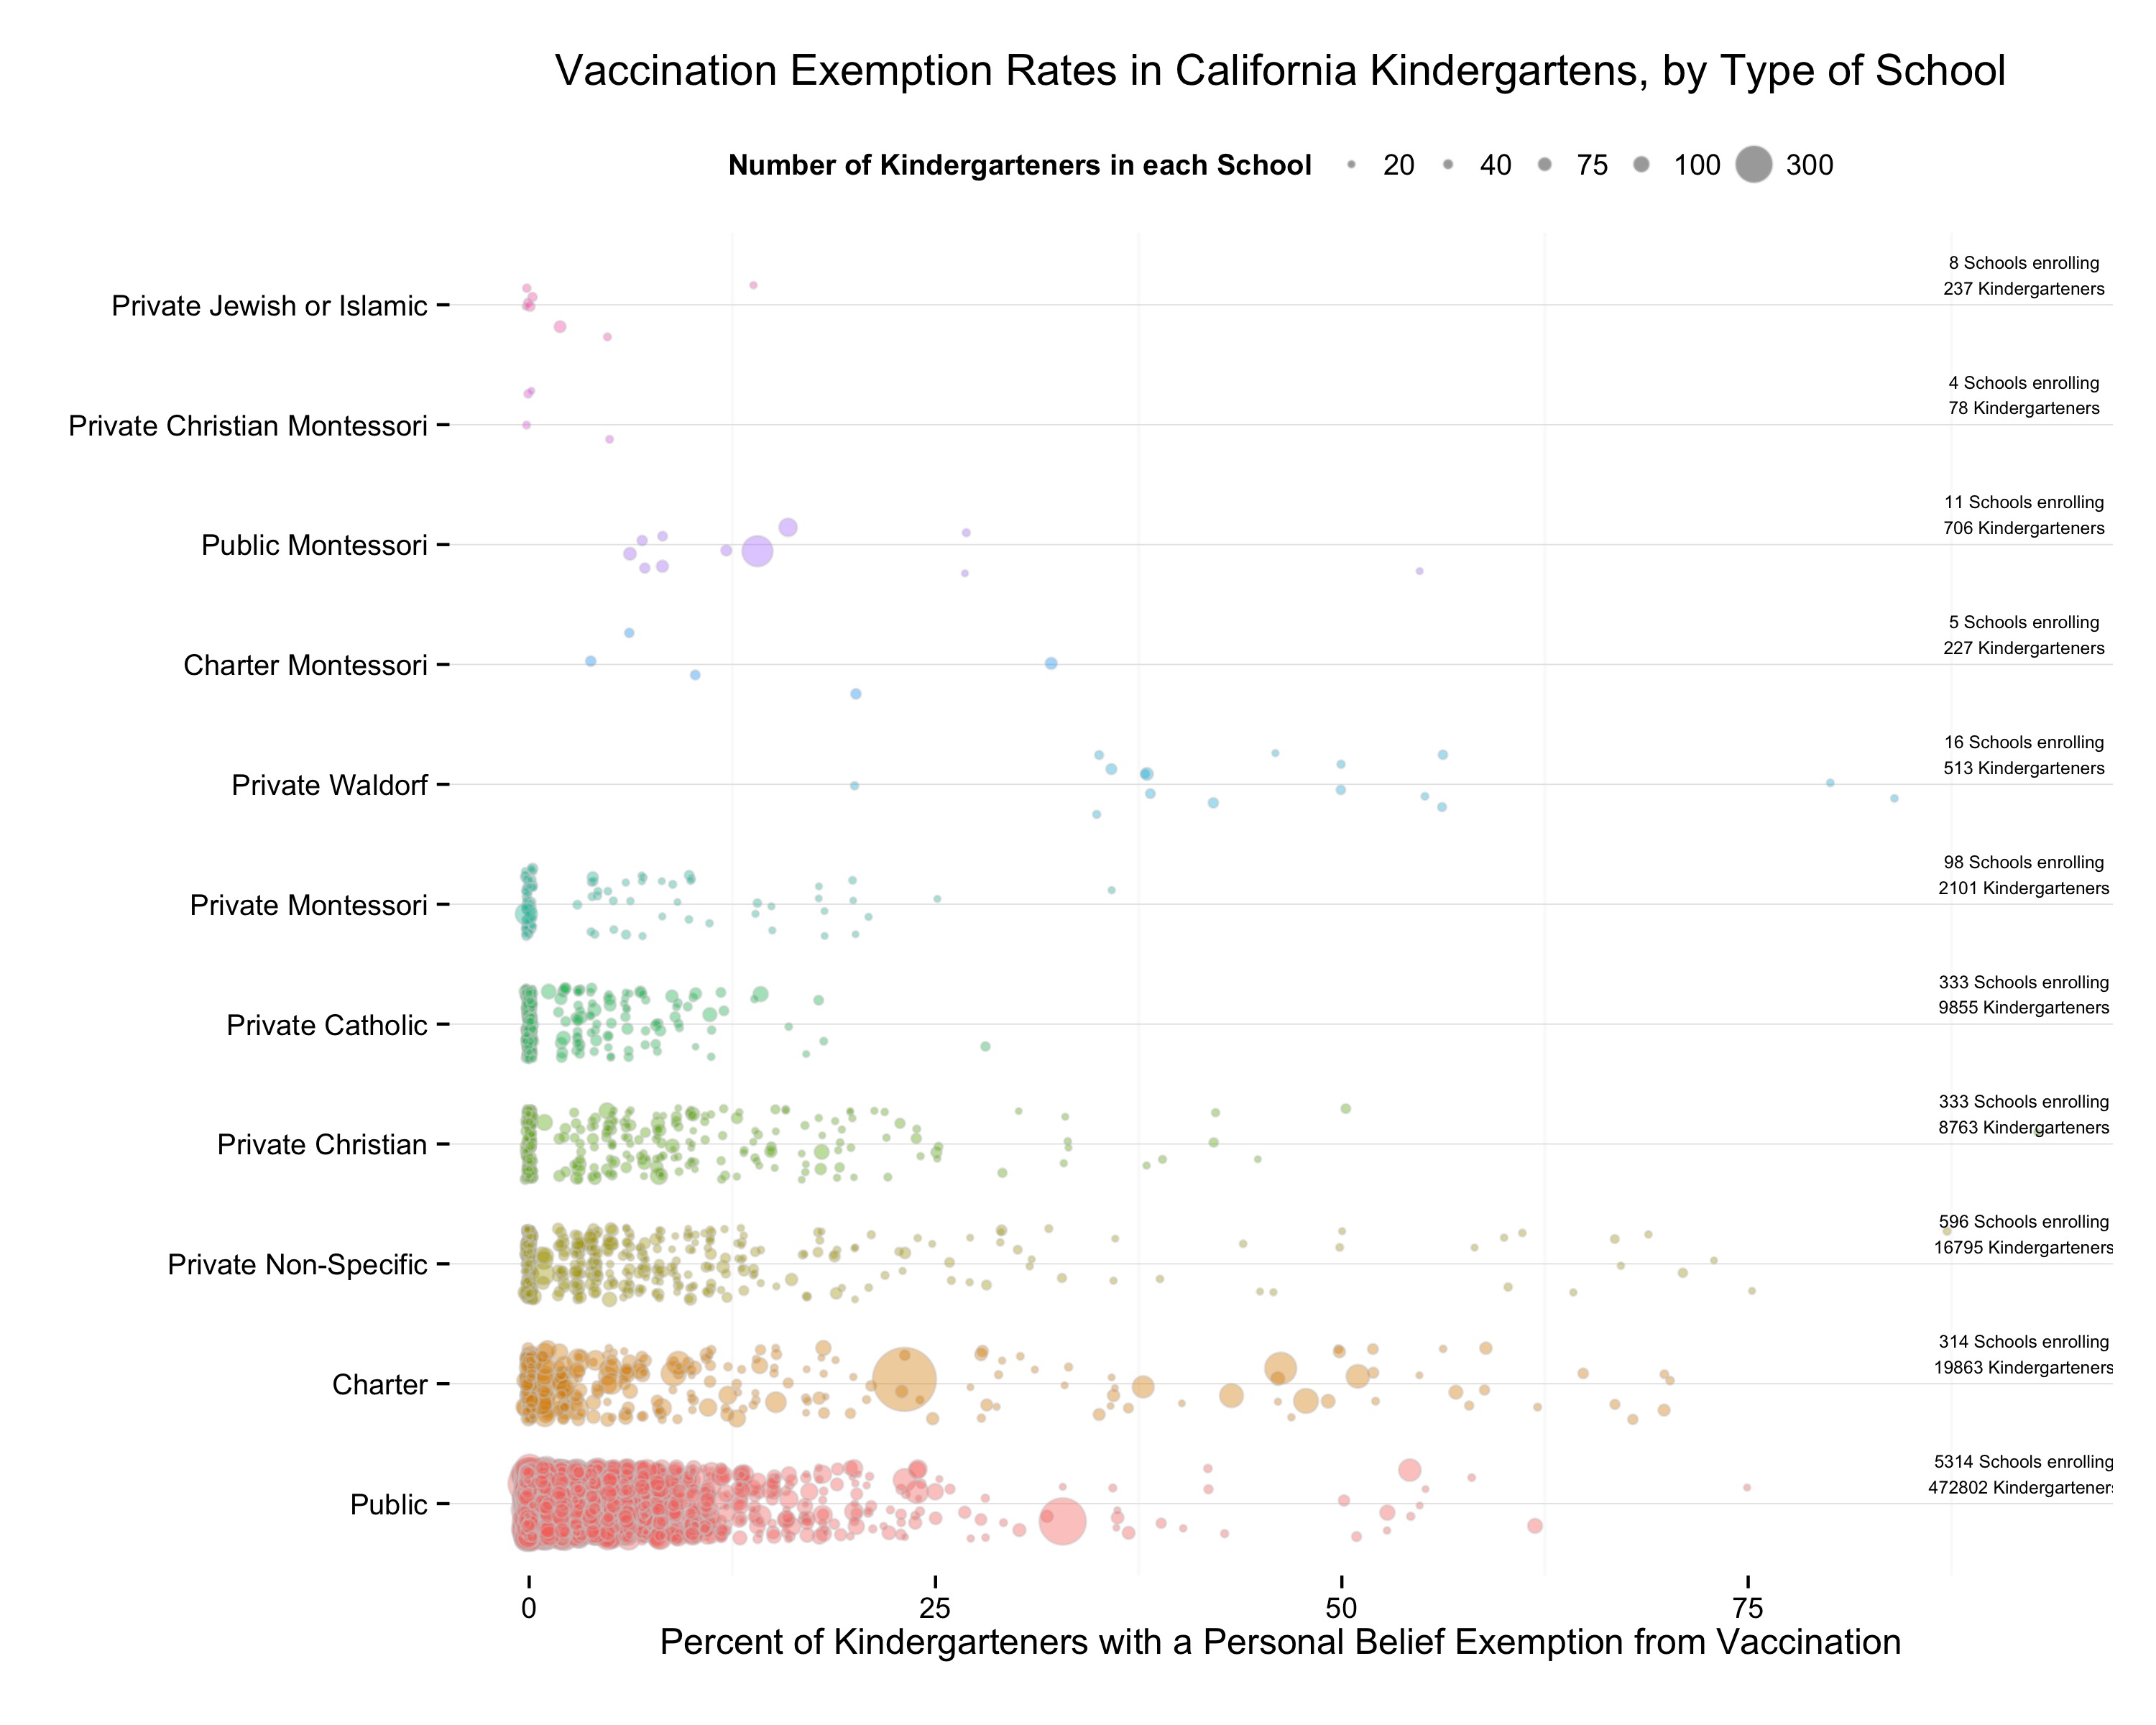
California Kindergarten PBE Rates by Type of School, 2014-15.
I came across a report this afternoon, via Eric Rauchway, about high rates of vaccination exemption in Sacramento schools. As you are surely aware, this is a serious political and public health problem at the moment. Like Eric, I was struck by just how high some of the rates were. So I went and got the data from the California Department of Public Health, just wanting to take a quick look at it. If you want to follow along, I put up a github repository with the data and R code for the plots.
I’ll just confine myself to a few descriptive plots about “PBEs” or Personal Belief Exemption rates amongst children in kindergarten across the state. I’ll say “children” for convenience in this post but I mean kindergarten-age children only, not all elementary-school kids. We have information from about 7,500 schools (of the 8,100 or so in the state). Because I’m just interested in exemption rates with respect to enrollments in the school, the number of usable observations is a bit smaller—just over 7,000 schools. In that population, across the whole state, just 3.36 percent of kindergarteners have a PBE. Note that although 96.6% of children don’t have a PBE that doesn’t mean they are all vaccinated. Most of them are, but for some the paperwork was missing at the time of reporting, or they don’t have all their vaccinations, or they have a medical exemption, and so on. The data contain those different measures but I don’t discuss them here.
One of the most interesting things about vaccination exemptions is how they cluster, and how much variability in vaccination rates changes as you look at more fine-grained resolutions. As a first cut, we can look just at public vs private schools. Right away a little gap opens up. From a base rate of 3.36% PBEs we find that only 2.84% of public school kindergarteners have PBEs, while 5.47% of private school kindergarteners do. There are far more kindergarteners in public than private schools (483,598 vs 38,342).
Next level of resolution down is the county. Here is a plot of PBE rates by county. We log the number of enrolled children on the x-axis to stop very high-population counties, notably L.A. County, from skewing the plot.
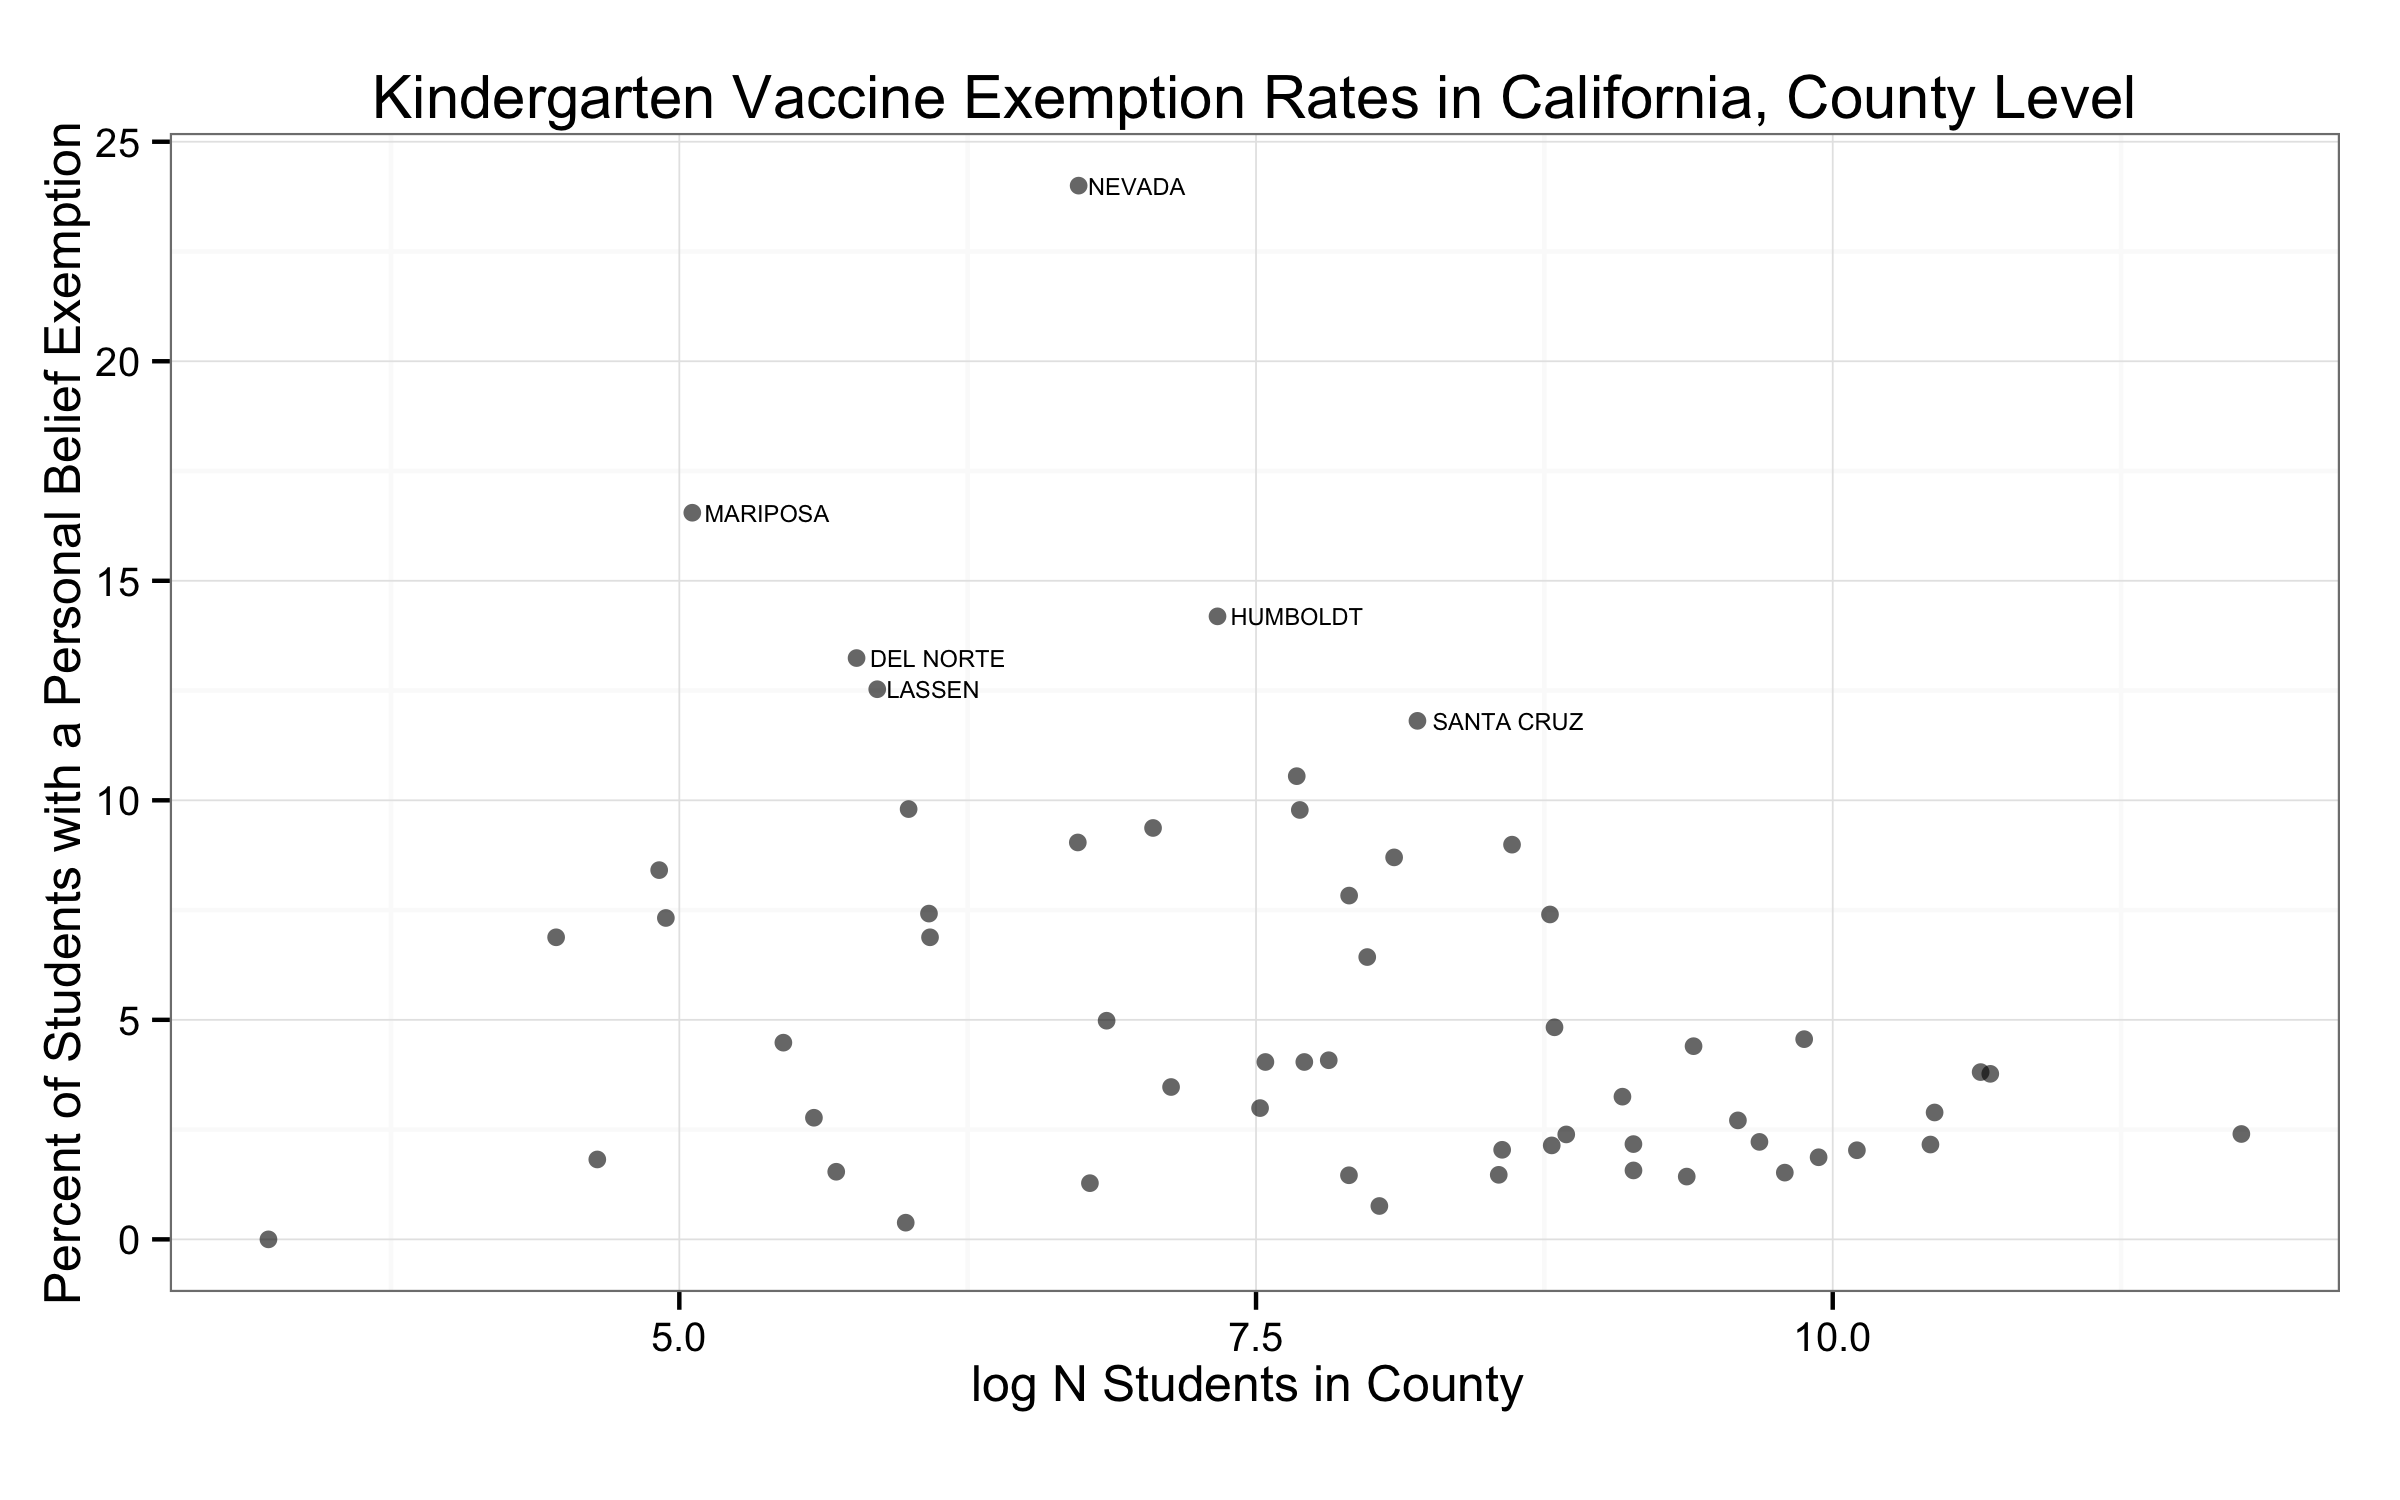
California Kindergarten PBE Rates by County, 2014-15.
The figure picks out some outlying counties—those with more than twice the interquartile range for PBEs. With nearly sixty counties, we see there’s a fair amount of heterogeneity hiding in the state-level PBE rate. Our outlying counties have PBE rates of more than 10 percent.
The next twist of the lens is to look at the rates by district. In our population there are just over 820. Here’s what they look like.
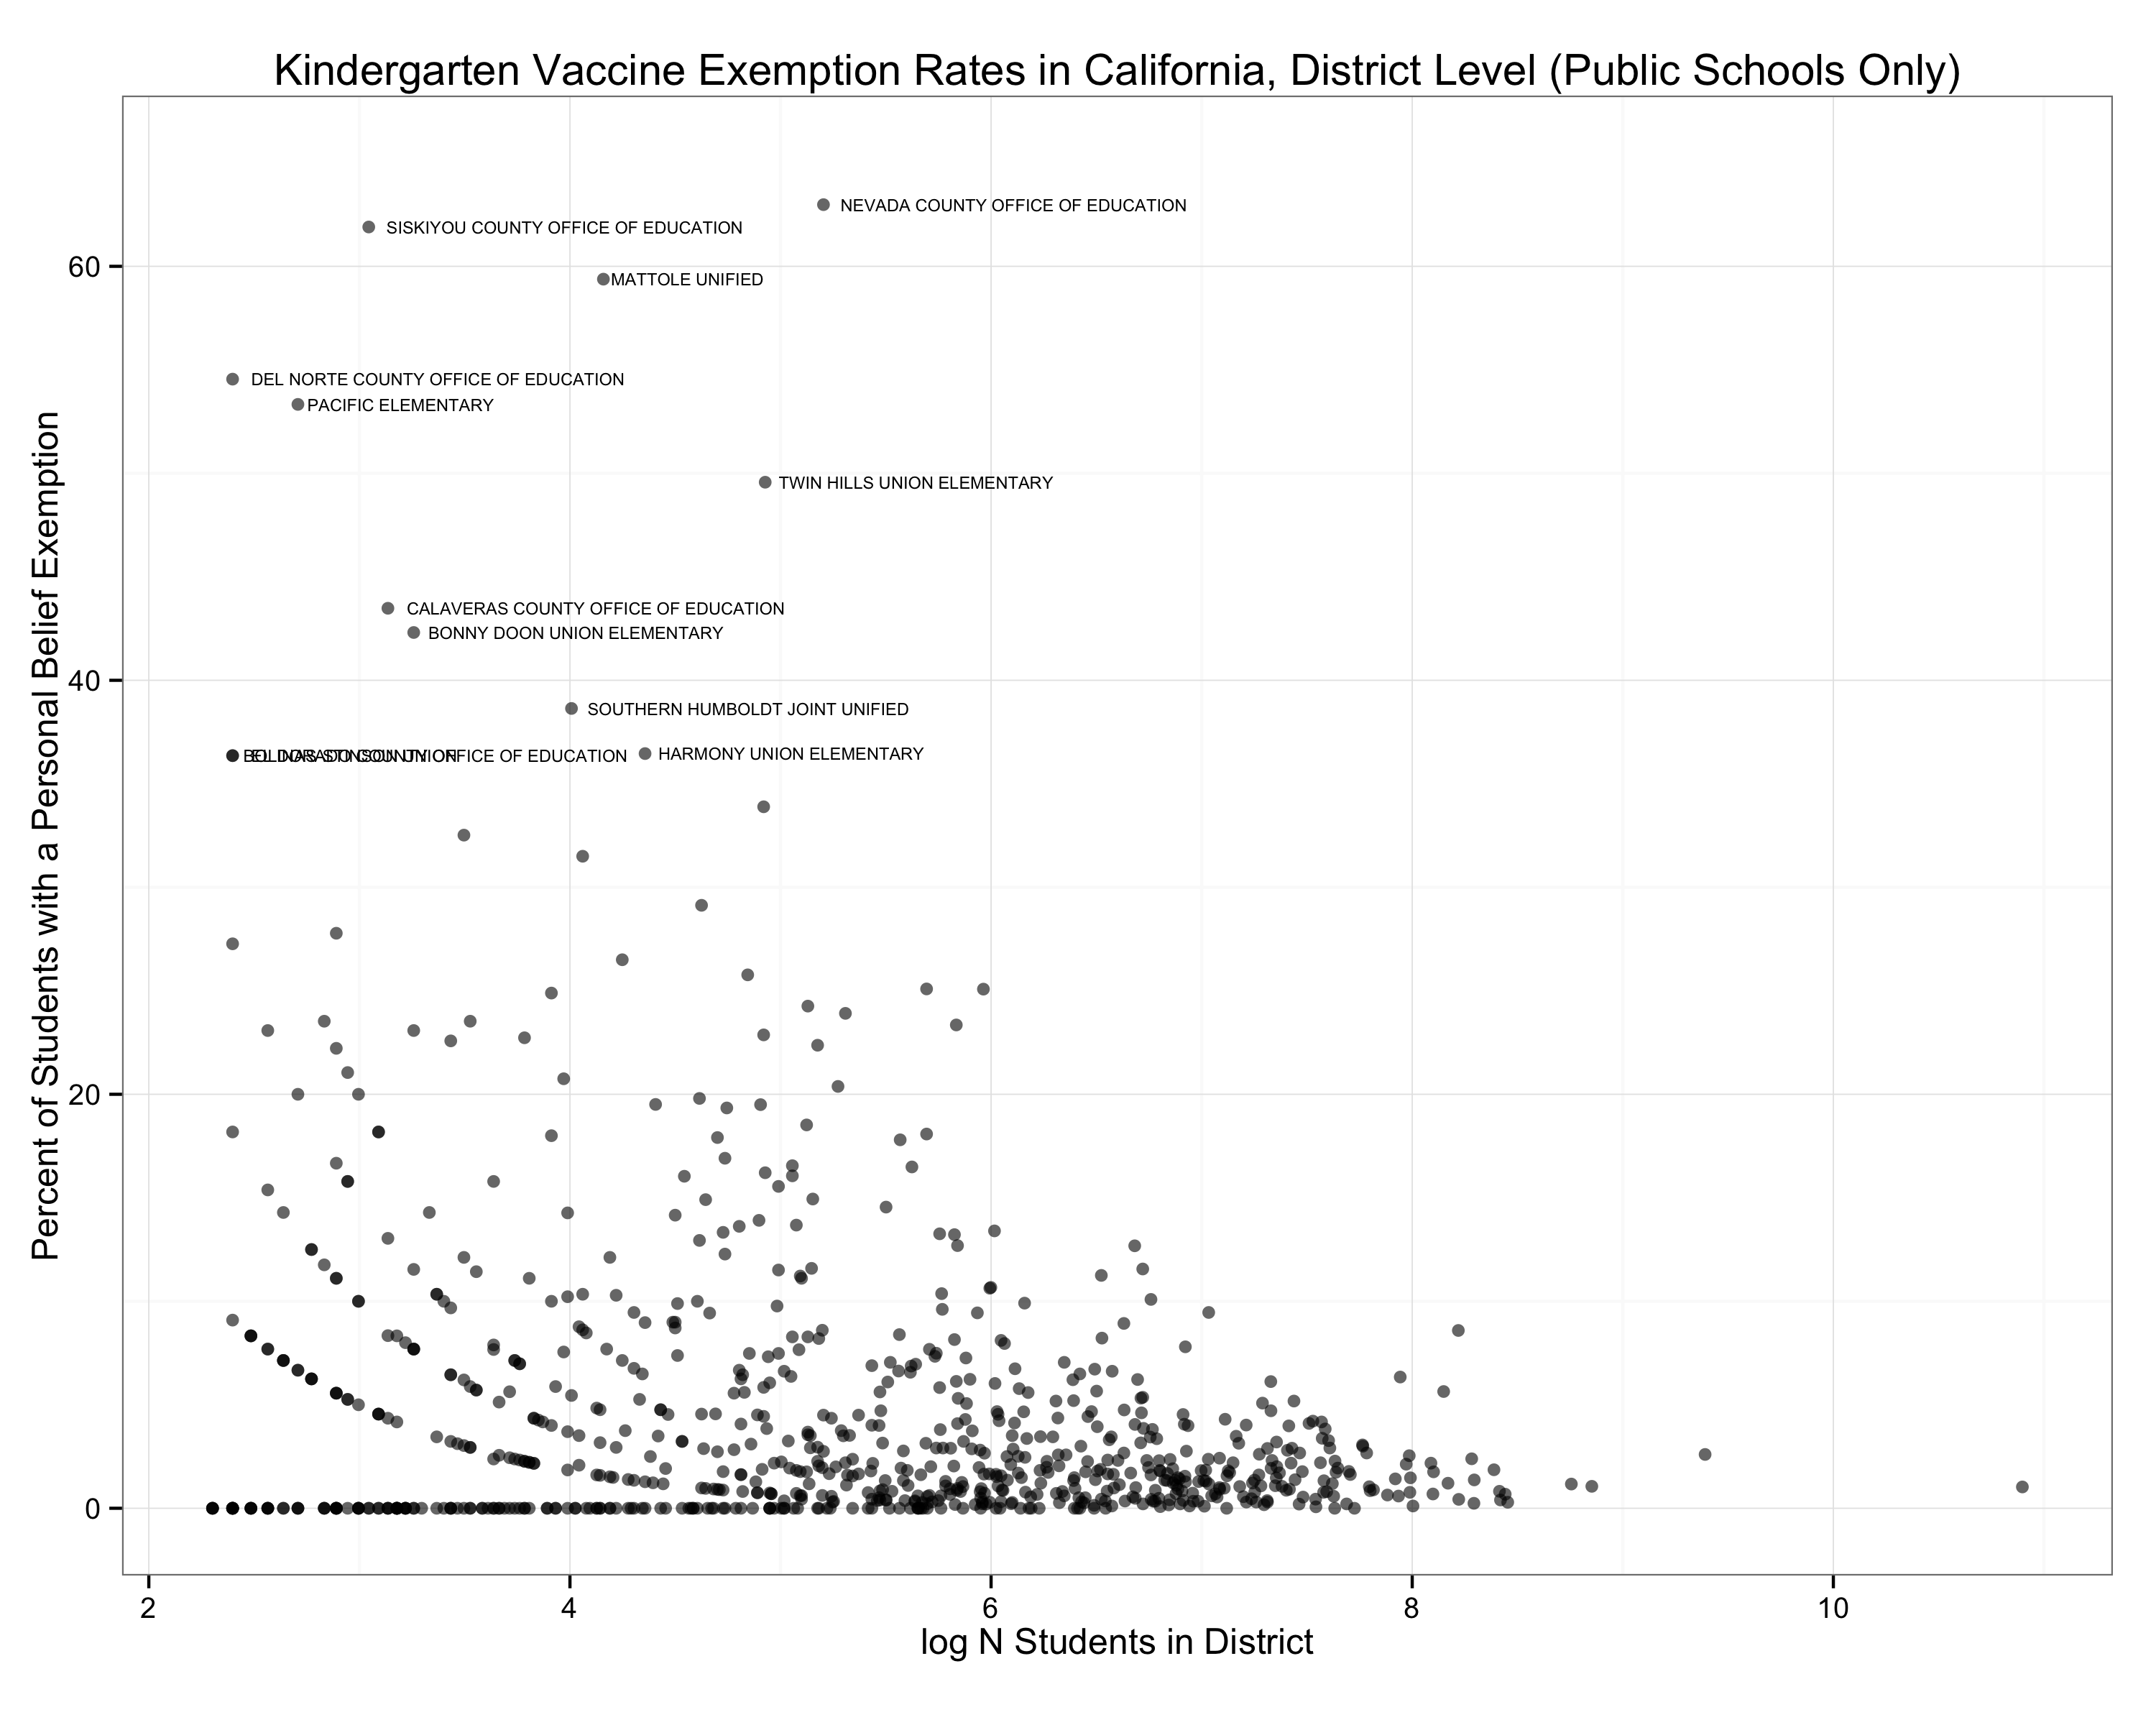
California Kindergarten PBE Rates by Public School District, 2014-15.
The x-axis covers more or less the same range (logged N students), but note that instead of topping out at 25 our y-axis now runs from zero to over sixty percent. A big jump. (And our criteria for getting a label goes from 2x the IQR to 6x.) Note that most of the high-rate districts enroll small numbers of students. Some of those districts have very few schools: the Siskiyou County Office of Education district has one Kindergarten group in the data, Golden Eagle Charter, with twenty one kindergarteners and a PBE rate of sixty two percent. Meanwhile the Nevada County district is more consistently an outlier. It has five schools in the data, enrolling 182 students in total with a PBE rate of 63 percent. Note that here, because we’re looking at public school districts, we are excluding private schools. Charter schools are included.
Finally here is the school-level distribution. Because we can look at all of them I’ve distinguished the public and private schools. The banding is an artifact of having the enrollment number in the calculation of both the x-axis (log Enrollment) and the y-axis (PBE students / Enrollment).
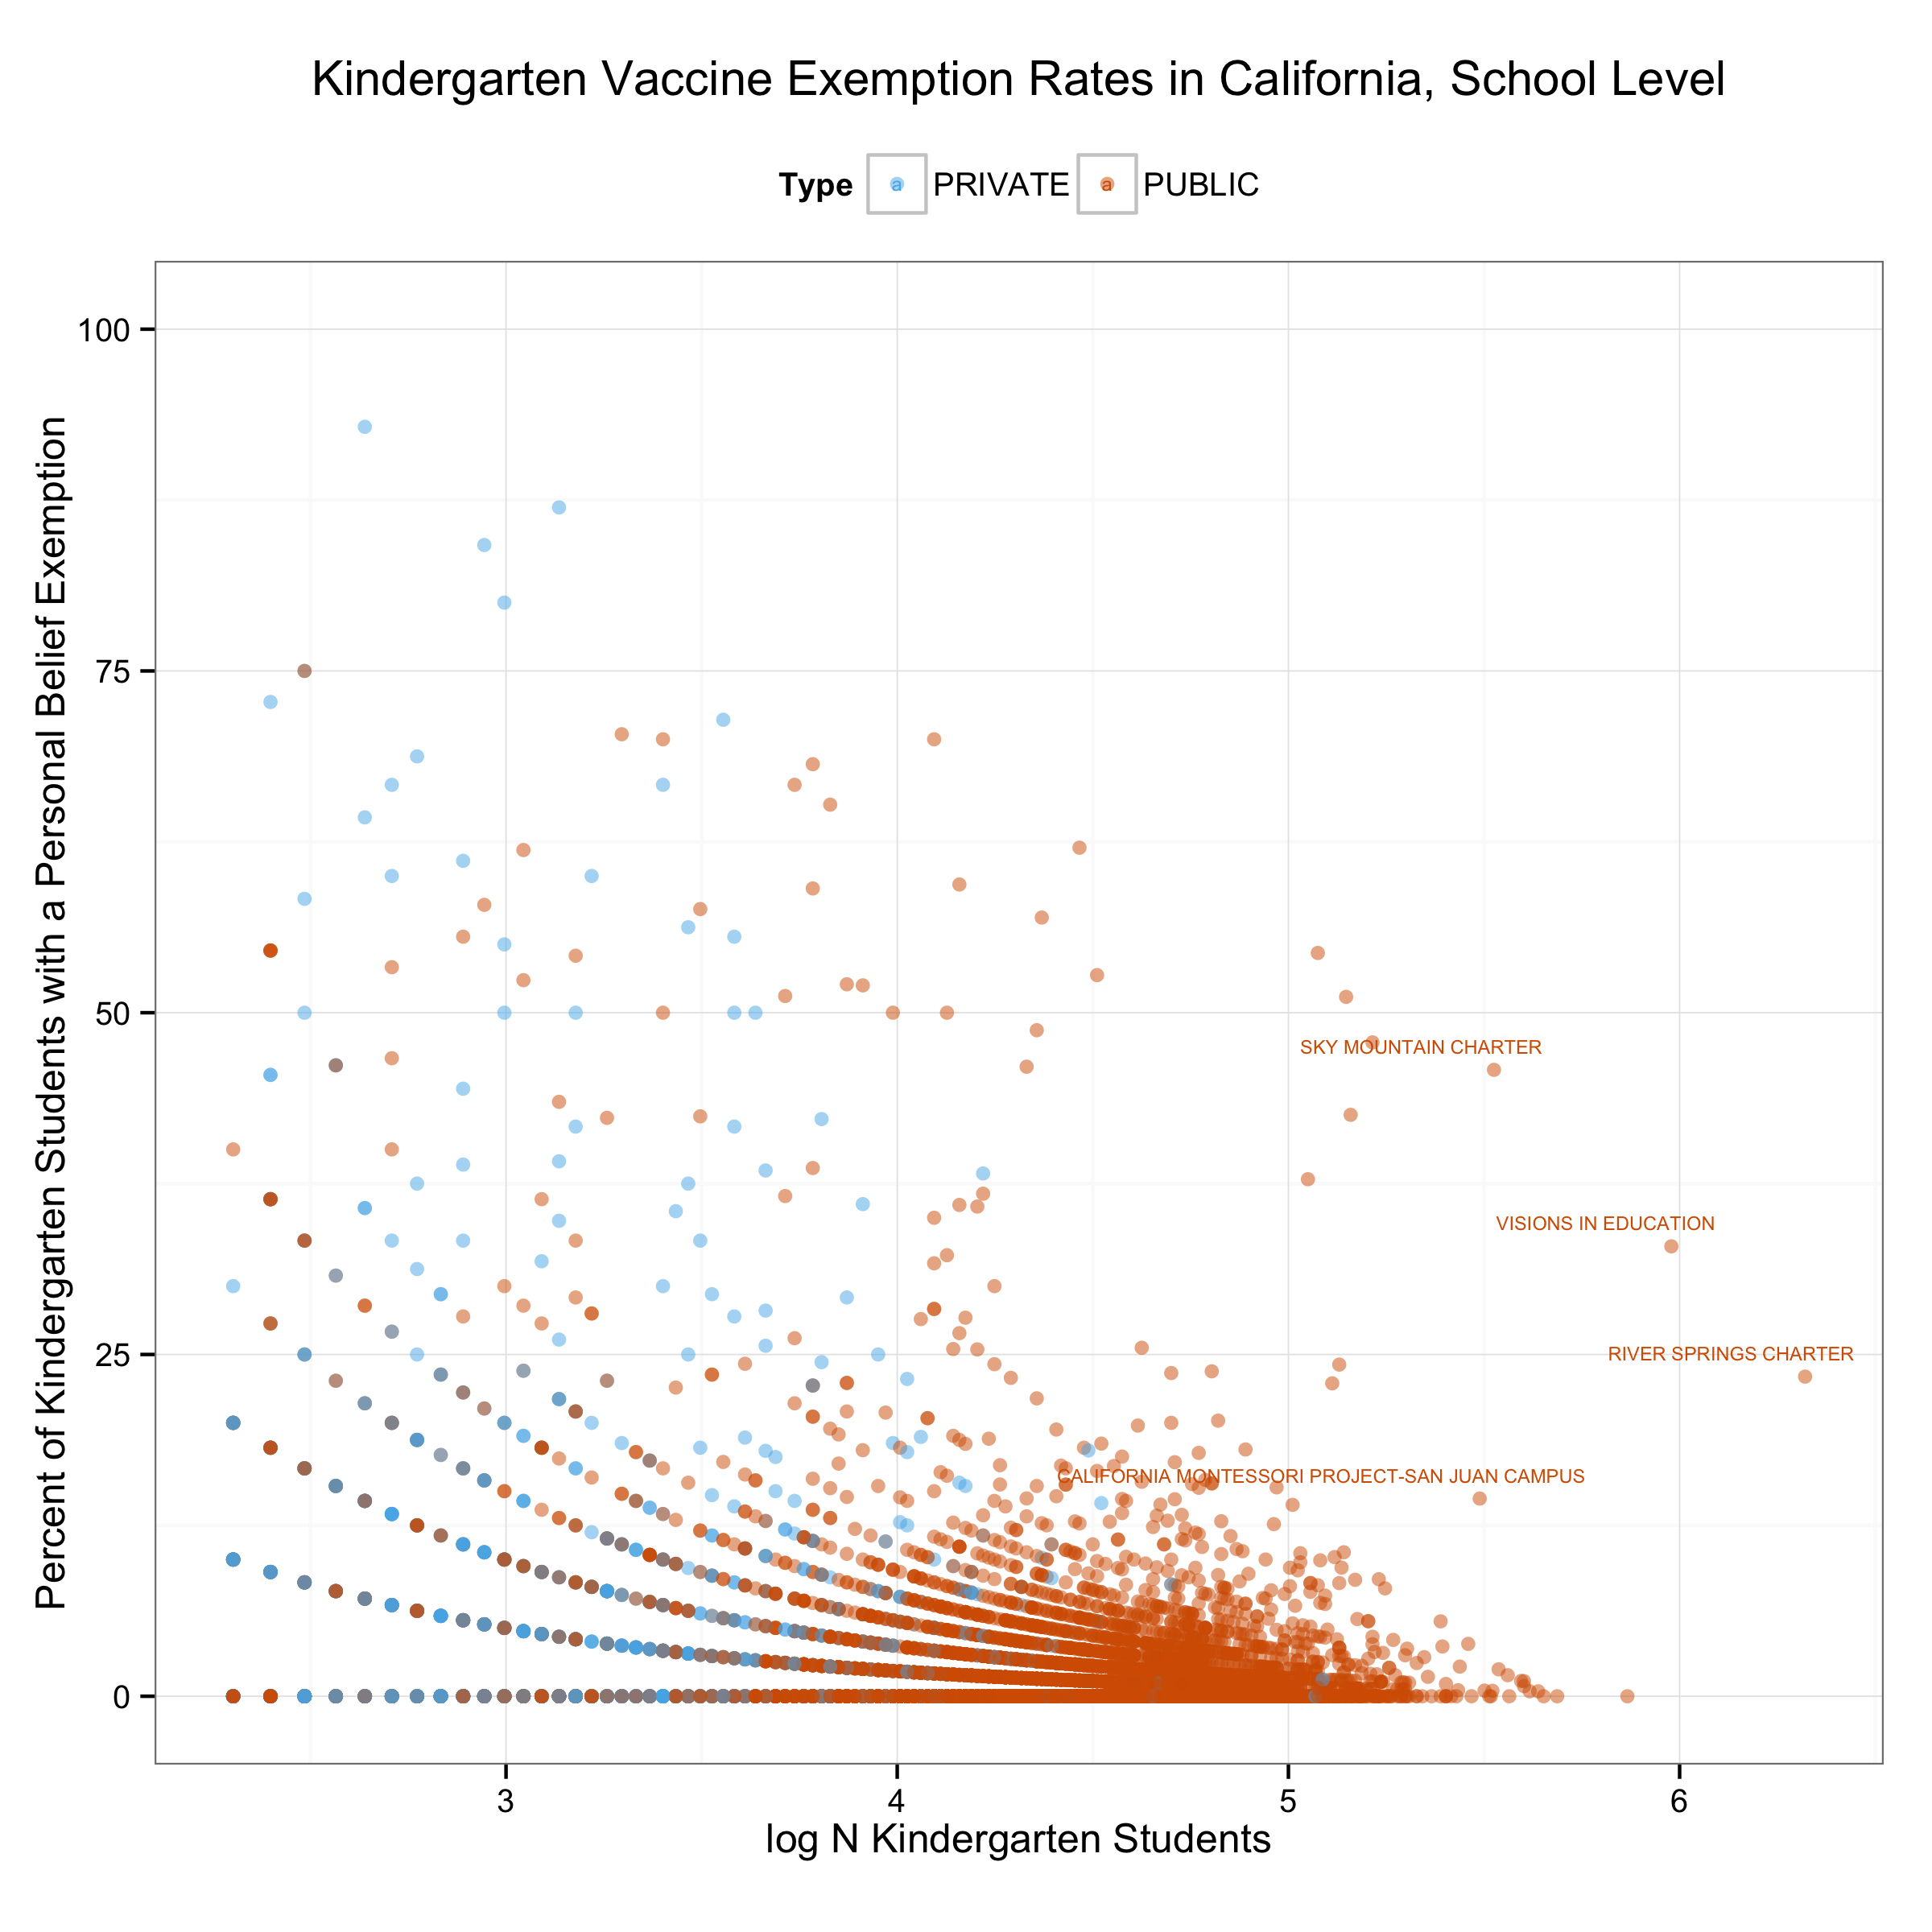
California Kindergarten PBE Rates by School, 2014-15.
Now our y-axis has is pushed all the way to 100. The school with the highest PBE rate in the state is the Grace Family Christian School in Sacramento, with 93%. Next comes the Berkeley Rose School in Alameda County (87%), the Cedar Springs Waldorf in El Dorado (84%), Westside Waldorf in LA (80%) and the Kabbalah Children’s Academy in Los Angeles (75%, and yeah, I know). These are all relatively small schools and all are private. The median school enrolled seventy three kindergarteners (across several classrooms, of course). These five schools range from twelve to twenty three kindergarteners. Of the ten schools with the highest PBE rates, three are public. Two of those are in Nevada County, and the other is a public school in Sebastopol that enrolled twelve kindergarteners.
The concentration of PBEs in smaller schools is evident, as is the concentration in private schools. Note that regions with high PBE schools can still show a lot of heterogeneity. For example, consider schools in Berkeley. On the one hand it is home to the school with the second-highest PBE rate in the state. On the other hand, six of its fifteen other schools have PBEs of zero, two more are at three percent or lower, and the remainder range from six to sixteen percent PBEs. At the school level, the PBE rate for publics in Berkeley is 4.1% and for privates it is 18%. But there are far more children in the public schools, so at the student level the number of kindergarteners with PBEs, even in Berkeley, is not huge—about 67 kids out of 850 in the city. But 20 of those 67 are in the same school, and probably the same room.
Finally, the clustering also raises the question of whether there are big schools with a lot of PBEs. To bring this out a little more clearly here is the same figure as above but with the x-axis showing number of students rather than logged students.
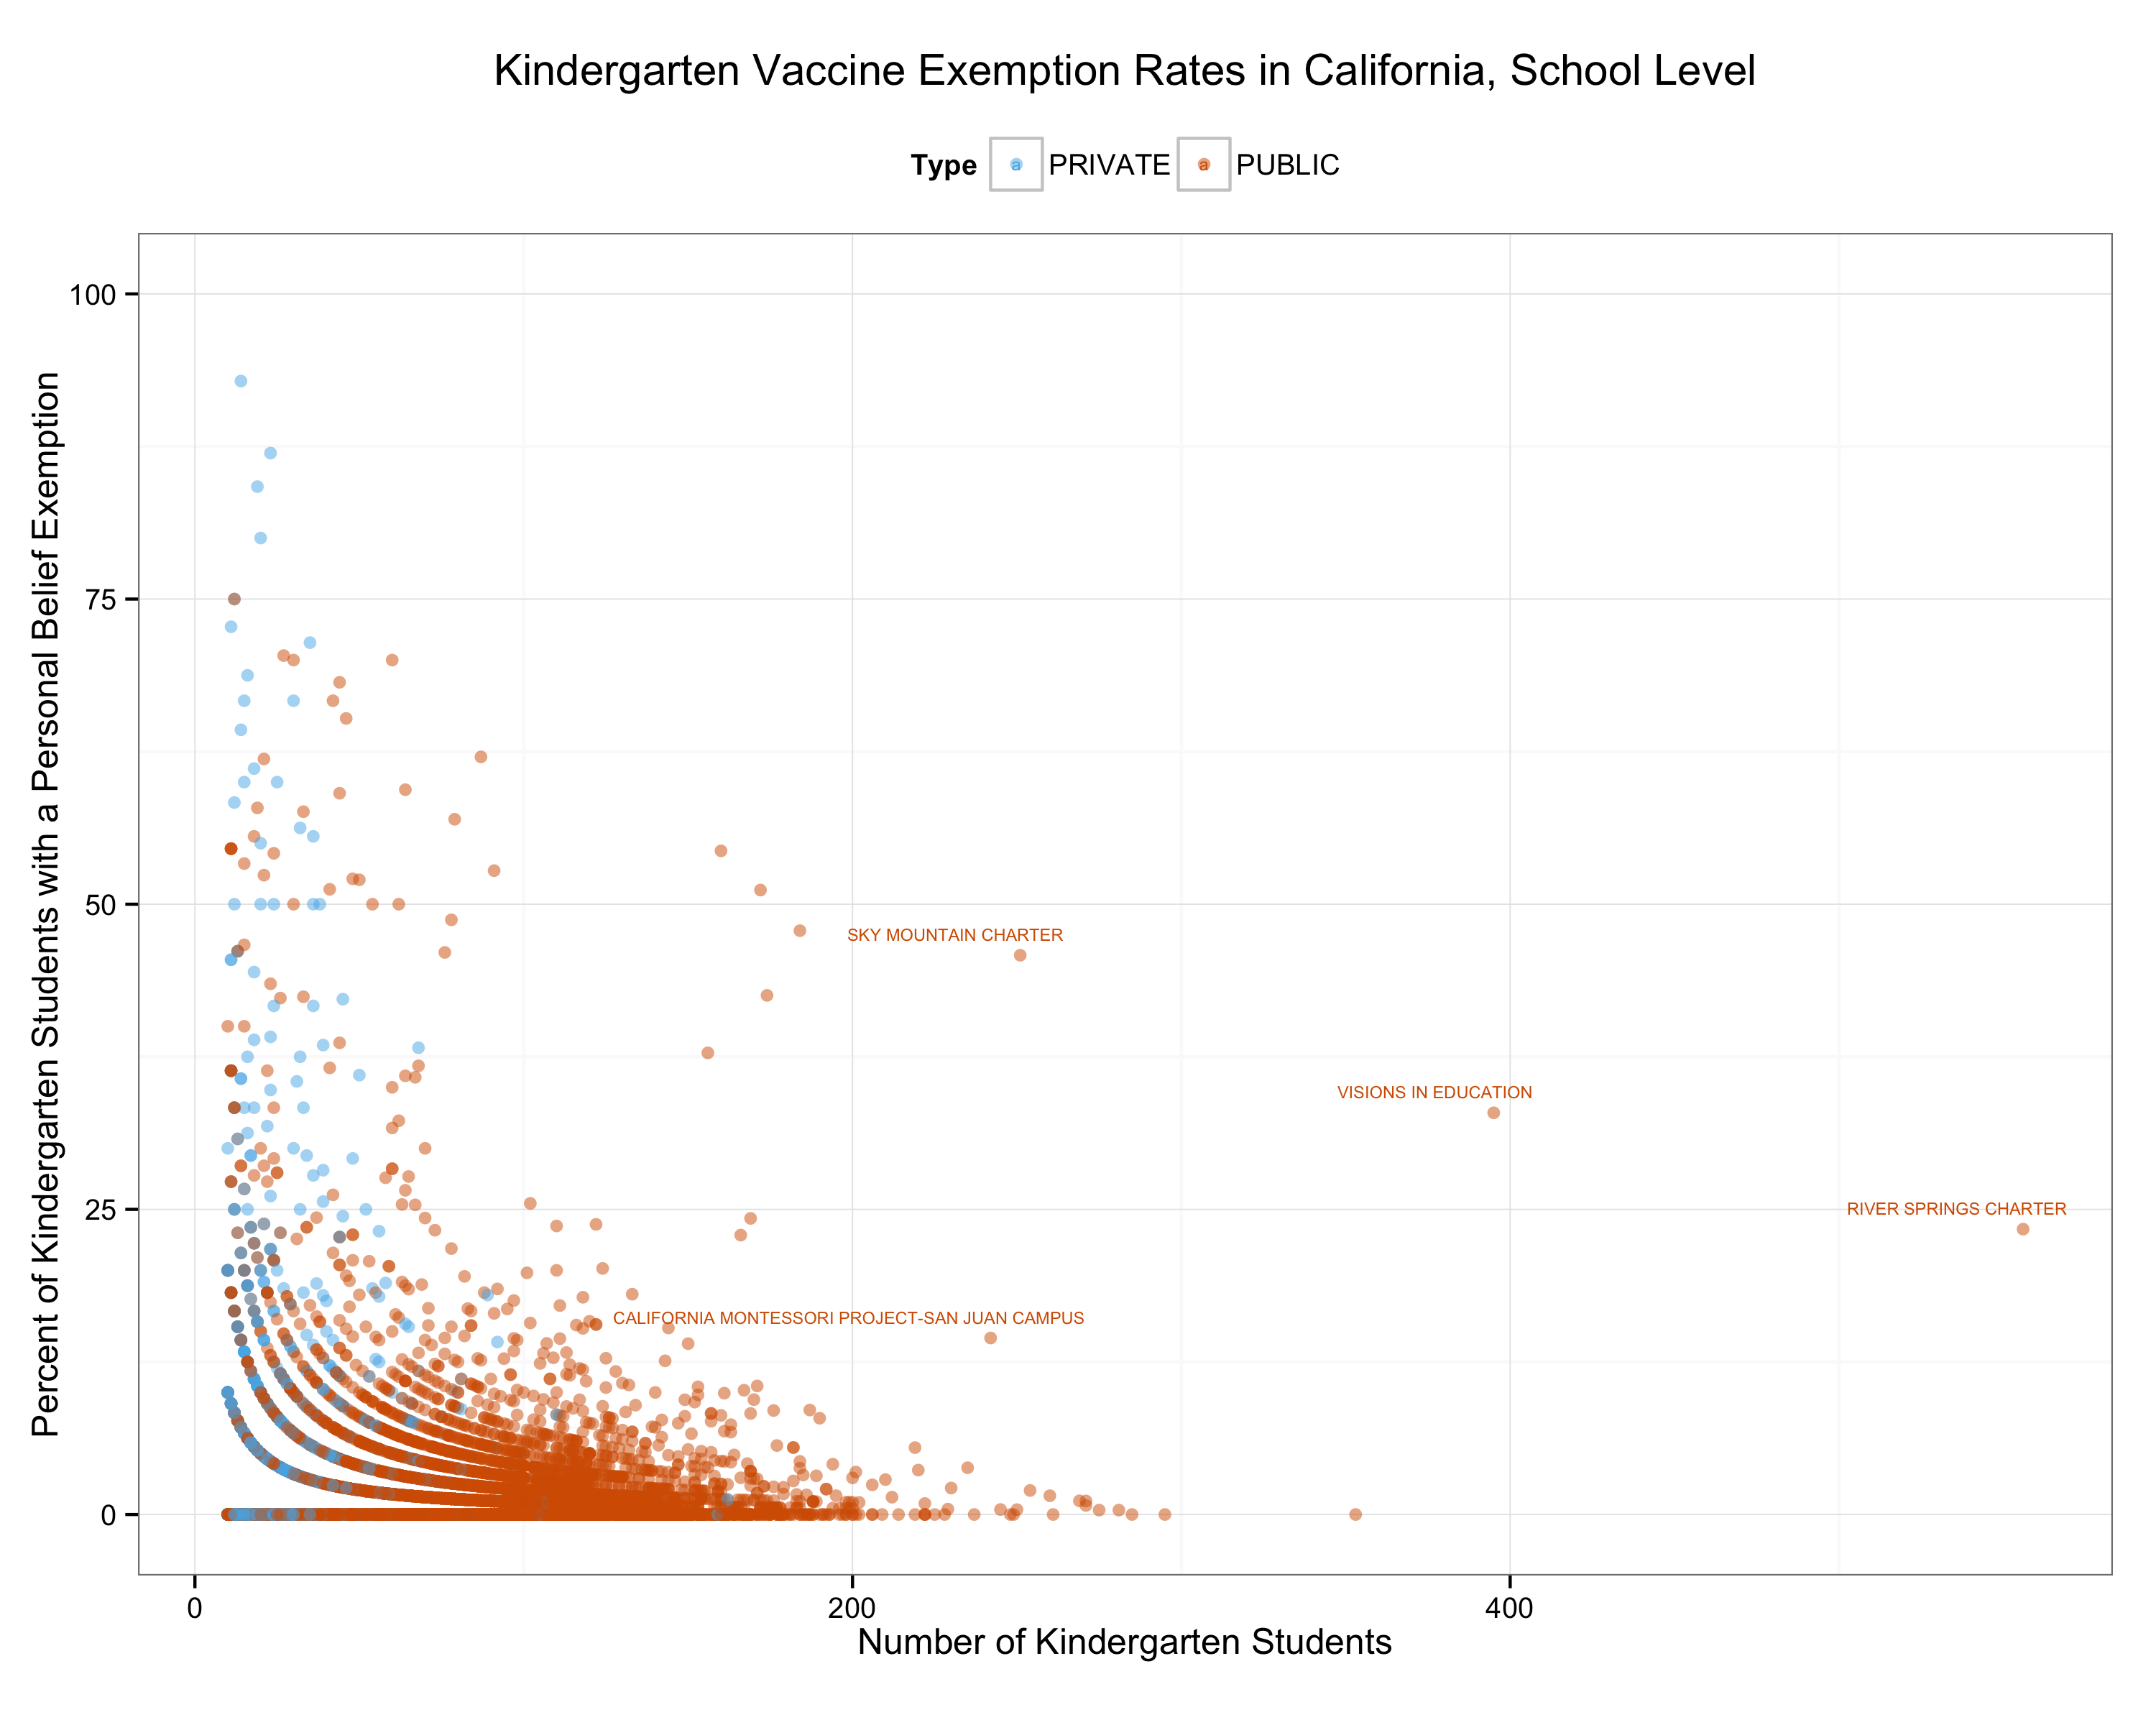
California Kindergarten PBE Rates by School, 2014-15.
Here we see a couple of schools that are enrolling a very large number of kindergarteners and also have relatively high PBE rates. Four schools in the state reported enrolling more than two hundred kindergarteners while also having PBE rates of over 10 percent. River Springs Charter reported 556 students and a PBE of 23 percent. Honestly this makes me wonder if the person filling out the form reported the size of the entire elementary school rather than the size of the kindergarten classes. But then again American schools can get pretty huge, so the data are right that’s a lot of little tykes and a 23 percent PBE. Much the same goes for the California Montessori and Visions in Education schools, which reported 242 and 395 enrollments respectively, with 14 and 33 percent PBEs. This brings us full circle as both of these schools are in the same district—the San Juan Unified district in Sacramento. Perhaps someone familiar with these schools can tell me whether the denominators they’re reporting are correct.
Update: Some follow-up from readers suggests these enrollment numbers are correct, but the schools may be unusual. Visions in Education and River Springs Charter, for instance, provide services to parents homeschooling their children. (The latter may also have a campus, I’m not sure.) So those students are likely not in the same building each day. I’ve also added the plot at the top of the page, which I discuss in this followup post.