Cool Waters
In a classic discussion of scientists sampling the ground in the Amazon rainforest, Bruno Latour details the process through which physical bits of soil are turned into recorded measurements and data points for comparison and analysis. He remarks,
Stage by stage, we lost locality, particularity, materiality, multiplicity, and continuity, such that, in the end, there was scarcely anything left but a few leaves of paper. … But at each stage we have not only reduced, we have also gained or regained, since, with the same work of representation, we have been able to obtain much greater compatibility, standardization, text, calculation, circulation, and relative universality, such that by the end, inside the field report, we hold not only all of Boa Vista (to which we can return), but also the explanation of its dynamic.
Now, via Andrew Gelman, a fascinating story from Quirin Schiermeier at Nature about the social production of data.
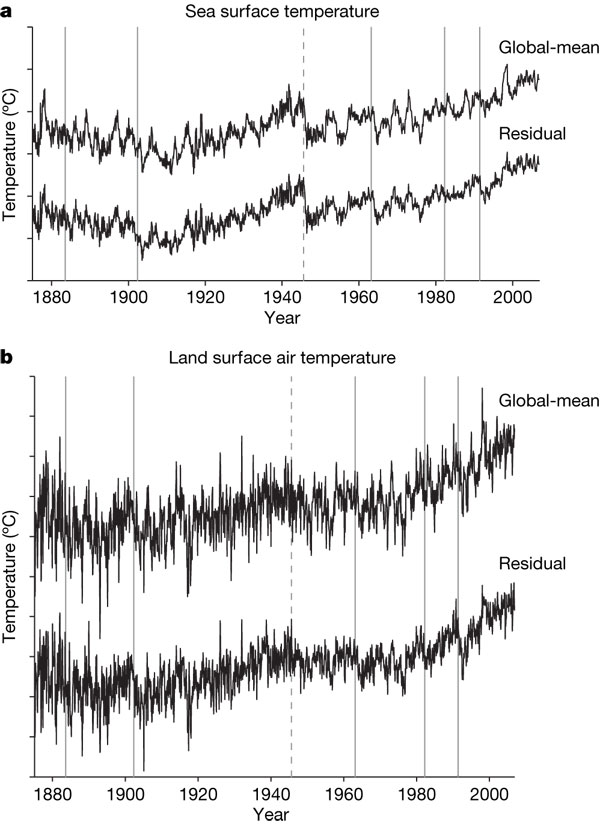
The 20th century warming trend is not a linear affair. The iconic climate curve, a combination of observed land and ocean temperatures, has quite a few ups and downs, most of which climate scientists can easily associate with natural phenomena such as large volcanic eruptions or El Nino events. But one such peak has confused them a hell of a lot. The sharp drop in 1945 by around 0.3 °C – no less than 40% of the century-long upward trend in global mean temperature – seemed inexplicable There was no major eruption at the time, nor is anything known of a massive El Nino that could have caused the abrupt drop in sea surface temperatures. The nuclear explosions over Hiroshima and Nagasaki are estimated to have had little effect on global mean temperature. Besides, the drop is only apparent in ocean data, but not in land measurements. Now scientists have found – not without relief – that they have been fooled by a mirage.
The mysterious post-war ocean cooling is a glitch, a US-British team reports in a paper in this week’s Nature. What most climate researchers were convinced was real is in fact “the result of uncorrected instrumental biases in the sea surface temperature record,” they write. Here is an editor’s summary.
So, what’s the explanation? The post continues:
How come? Almost all sea temperature measurements during the Second World War were from US ships. The US crews measured the temperature of the water before it was used to cool the ships engine. When the war was over, British ships resumed their own measurements, but unlike the Americans they measured the temperature of water collected with ordinary buckets. Wind blowing past the buckets as they were hauled on board slightly cooled the water samples. The 1945 temperature drop is nothing else than the result of the sudden but uncorrected change from warm US measurements to cooler UK measurements, the team found.
And from here it is a short hop back to Latour:
That’s a rather trivial explanation for a long-standing conundrum, so why has it taken so long to find out? Because identifying the glitch was less simple than it might appear, says David Thompson of the State University of Colorado in Boulder. The now digitized logbooks of neither US nor British ships contain any information on how the sea surface temperature measurements were taken, he says. Only when consulting maritime historians it occurred to him where to search for the source of the faintly suspected bias.